Bull Flag vs Bear Flag Patterns: A Beginner’s Guide

Key Insights
- Both bull and bear flags consist of a sharp price movement (the pole) followed by a tight, slanted consolidation (the flag), and they often resolve in the same direction as the pole when volume surges back.
- Successful flag breakouts require a three-step volume pattern: a surge during the pole, a decline during the flag, and another surge on breakout; lack of volume confirmation often leads to failed signals.
- Effective trading with flag patterns involves precise entries at breakout points, tight stop-loss placement beyond the flag boundary, and profit targets based on the measured move of the pole.
Before diving into the details, here is the gist: bull and bear flags are short-term continuation patterns that appear after a forceful price run or tumble. They consist of a swift “flag pole” followed by a tight, slanted pause, and they often resolve in the direction of the pole once volume floods back in. The resulting chart does actually look like a flag on a pole.
Correctly identifying the bull flag or a bear flag pattern, waiting for volume confirmation, and managing risk with stops and measured-move targets can turn these pauses into high-probability trades – especially when the flag lines up with broader trend tools such as moving averages, RSI swings, or Fibonacci retracements.
Introduction: The Power of Flags in Crypto Trading
Technical analysis rests on the idea that recurring price formations reveal trader psychology. Continuation patterns – shapes suggesting a trend is only pausing – are prized because they offer entries with the trend rather than against it. The bull and bear flags are two of the clearest of these formations, widely used in equities, forex, and now crypto markets to anticipate the next thrust once a brief consolidation ends.
Bull Flag and Bear Flag Patterns: A Visual Guide
Now we move on to the very definition of a flag pattern (touching upon the bull flag pattern vs bear flag pattern issue), and what you need to look for when identifying a pole and a flag. Now you may get more insight on how to read a bull flag chart or a bear flag chart.
What is a Flag Chart Pattern?
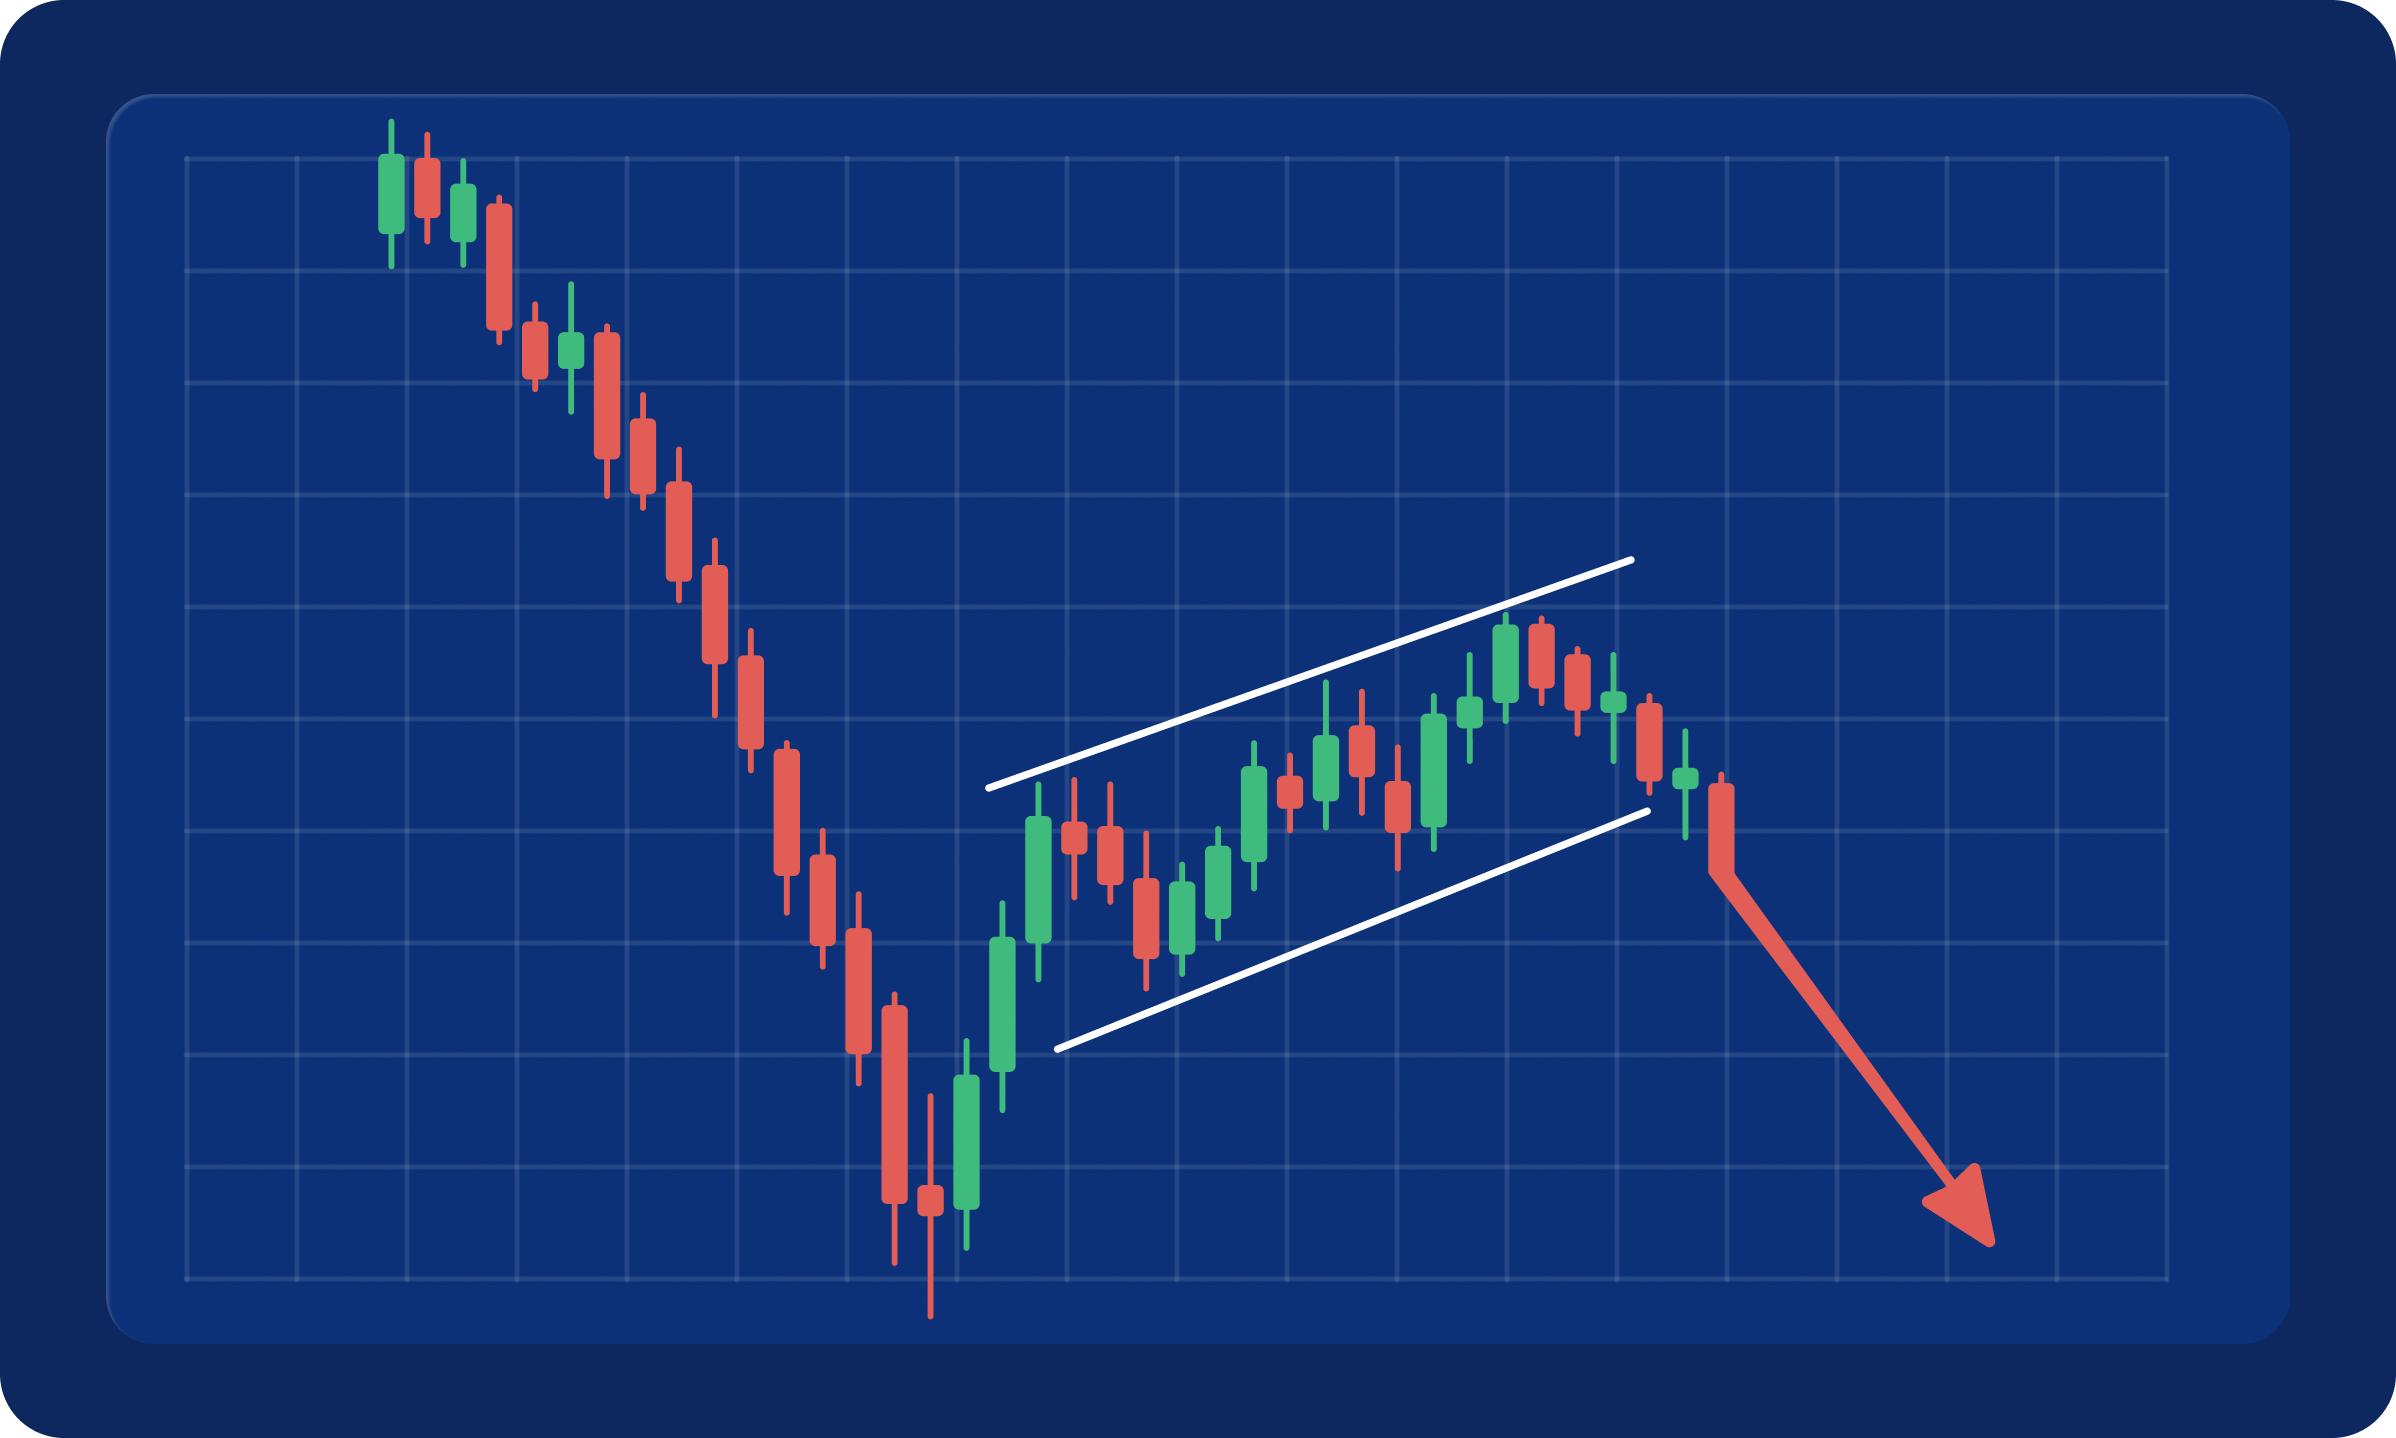
Flag pattern consists of two elements: a near-vertical move known as the pole and a narrow rectangle or parallelogram that slopes modestly against that impulse. The geometry signals that the market is pausing rather than reversing – traders are digesting gains or losses before deciding whether to continue.
Identifying the Pole and the Flag
Look first for an outsized rally or drop produced by only a handful of candles and accompanied by heavy volume – that is the pole. Next, mark the consolidation by drawing two parallel trend-lines that capture the sideways-to-slanted drift; this channel is the flag. Here you can read further on how to read crypto charts.
Ideal Flag Pattern Characteristics
Highly reliable flags share three traits:
Explosive pole – long candles on expanding turnover show conviction.
Orderly flag – price contracts inside parallel lines while volume dries up, hinting at reduced counter-trend interest.
Clean breakout level – the flag boundary offers an unambiguous trigger for entries and exits.
If you are inclined on learning more about flags and, more broadly, other important concepts seen on crypto charts, the SimpleSwap analysts prepared a piece on that.
Bull Flag vs. Bear Flag: Key Differences & Characteristics
What does a bear flag look like? What is a bull flag? And how does the bull flag vs bear flag comparison go? Here is how you can differentiate one form the other and see how a price chart with a bearish trend or a bullish one might look like.
Bullish Flag Pattern: Riding the Uptrend
A bull flag appears after aggressive buying forces price upward, then stalls in a gentle downward or horizontal drift. When buyers return and break the upper trend-line, the uptrend often resumes.
Bearish Flag Pattern: Spotting Downtrend Continuations
So, what is a bear flag? A bear flag chart pattern is the mirror image of the bullish one: a hard sell-off forms the pole, followed by a meek rebound that slopes upward inside a tight channel. A decisive break beneath the lower trend-line usually signals sellers are back in control.
Comparison of Bull and Bear Flag Patterns
In the bull flag vs bear flag comparison the orientation distinguishes the two – bull flags tilt down after an advance, bear flags tilt up after a decline – yet both share parallel boundaries, shrinking volume, and breakout potential in the direction of the prior move.
Volume Confirmation: The Golden Rule of Flag Patterns
Here let us look into the crucial thing in understanding bull and bear flags that is trading volume.
The Importance of Volume Technical Analysis
Textbook bull and bear flags exhibit a three-step volume rhythm: surge on the pole, fade inside the flag, surge again on breakout. This sequence helps filter false signals.
Volume During Flag Formation
A falling or flat volume during the flag chart pattern reading in the course of the consolidation shows the counter-trend is weak and likely temporary. If volume stays high, the pause may morph into a reversal instead.
Volume on Breakout
The breakout candle should arrive with a clear increase in turnover; without that boost, many bull and bear flags fail or whipsaw.
Trading Strategies: Putting Flag Patterns to Work
Below are three examples of how to utilize either a bearish flag pattern or a bullish flag pattern to trade more efficiently: consider the correct entry and exit points, identify a bearish flag, and implement other knowledge for the effective trading strategies.
Entry Points: Timing Your Trade
An assertive approach is to enter on the first close outside the flag boundary in the direction of the pole. A cautious method waits for a throw-back (bullish) or pull-back (bearish) that retests the breached line before committing.
Stop-Loss Placement: Managing Risk
Place the stop just beyond the opposite side of the flag – below the lower trend-line for bull flag trading, above the upper trend-line for bear flag trading – so a violation invalidates the structure promptly.
Profit Targets: Projecting Potential Gains
Many traders measure the pole’s height and project that distance from the breakout point – a technique known as the measured move. This objective offers a logical exit and aids in assessing risk-to-reward before entering.
Real-World Examples of Bullish and Bearish Flag Patterns
Bull and bear flag pattern can be observed in a variety of cases, two of which we list below.
Bitcoin bull flag: Suppose BTC surges from $60 000 to $65 000, then channels downward to $62 500 on lighter volume; a close above $64 000 completes the flag and implies a $69 000 target (pole height added to breakout).
Ethereum bearish flag chart: Imagine ETH plunges from $3 500 to $3 200, rebounds to $3 350, then breaks under $3 250 with higher volume; subtracting the $300 pole indicates a $2 950 objective if sellers maintain control.
(Traders should validate these levels on their own charts before acting.)
Risk Management: Protecting Your Capital with Flag Patterns
Using a flag pattern can also help with making your trading processes more secure, and this is how.
Position Sizing: Trading Responsibly
Traders may limit each trade to 1–2 % of account equity prevents a single failure from crippling the portfolio.
Stop-Loss Orders: Your Safety Net
Automated stops remove emotion and lock in a predetermined loss if the pattern fails.
Understanding Risk-Reward Ratio
Pursue setups with at least a 1:2 risk-to-reward relationship – over a series of trades, such math lets winners outweigh losers.
Combining Flag Patterns with Other Indicators
To make more informed trading decisions you might consider (always performing due diligence of course) combining a flag patter with another indicator. This below is how that may go.
Moving Averages: Identifying Trend Direction
Flags that form above rising moving averages (bull) or below declining ones (bear) align with macro momentum and have higher odds of success.
RSI: Overbought/Oversold Conditions
Allow RSI to cool off from extreme readings during the flag; breakouts that launch from a neutral oscillator tend to travel farther.
Fibonacci Retracement: Potential Support/Resistance
Flags often end near 38.2 % or 50 % retracements of the pole. Identifying those zones can sharpen entry timing and stop placement.
Common Mistakes & How to Avoid Them
Mislabeling the pattern: Converging trend-lines form wedges, not flags; confirm the lines run basically parallel.
Ignoring volume: A breakout on thin volume frequently reverses – always check the tape.
Chasing unrealistic targets: Use the measured move as a guide, but bank partial profits at nearby resistance or support to avoid round-tripping gains.
Conclusion: Mastering Flag Patterns for Crypto Success
Bull and bear flags condense fear, greed, and profit-taking into a compact blueprint. By mapping the pole, drawing the flag, verifying volume, and enforcing disciplined risk parameters, traders can transform these pauses into calculated entries that sync with the prevailing trend.
Add confirmation from other indicators and maintain strict money management, and the bull flag pattern and bear flag pattern become a reliable ally in the ever-volatile crypto arena. Stay patient, stay methodical, and let the market’s own pauses reveal its next move.
The information in this article is not a piece of financial advice or any other advice of any kind. The reader should be aware of the risks involved in trading cryptocurrencies and make their own informed decisions. SimpleSwap is not responsible for any losses incurred due to such risks. For details, please see our Terms of Service.


