Market Overview: August 2025

This blog post will cover:
- Stablecoin Growth in August
- The 51% Attack on Monero: A Signal for the Entire Industry
- Bitcoin Performance in August
- Ethereum Performance in August
- BTC Dominance & ETH/BTC Pair
- Altseason in 2025?
- Trading Activity & Volume
- Top Gainers & Losers
- Google Trends Analysis
- Market Sentiment in August
- What to Expect in September
- Conclusion
August has historically been one of the toughest months for the crypto market. Over the past 12 years, Bitcoin has closed the month in the green only 4 times, while posting losses in 8 cases. August 2025 was no exception: Bitcoin ended the month down 6.49%, despite reaching a new all-time high (ATH) of $124,474. Ethereum also set a new ATH at $4,956, but unlike Bitcoin, it closed August with a strong +18.75% gain.
This made August a month of contrasts. In the first half, the market maintained July’s momentum, when ETH experienced record-breaking growth and BTC posted new ATHs. However, the second half of the month saw a correction driven by profit-taking and overheated market conditions.
The industry is now fully restructuring under the new institutional framework. Cryptocurrencies are becoming increasingly integrated into the global financial system, the digital dollar is solidifying as part of the core infrastructure, major banks are actively testing DeFi solutions, and U.S. regulators are shaping a policy direction that supports stablecoins and Web3.
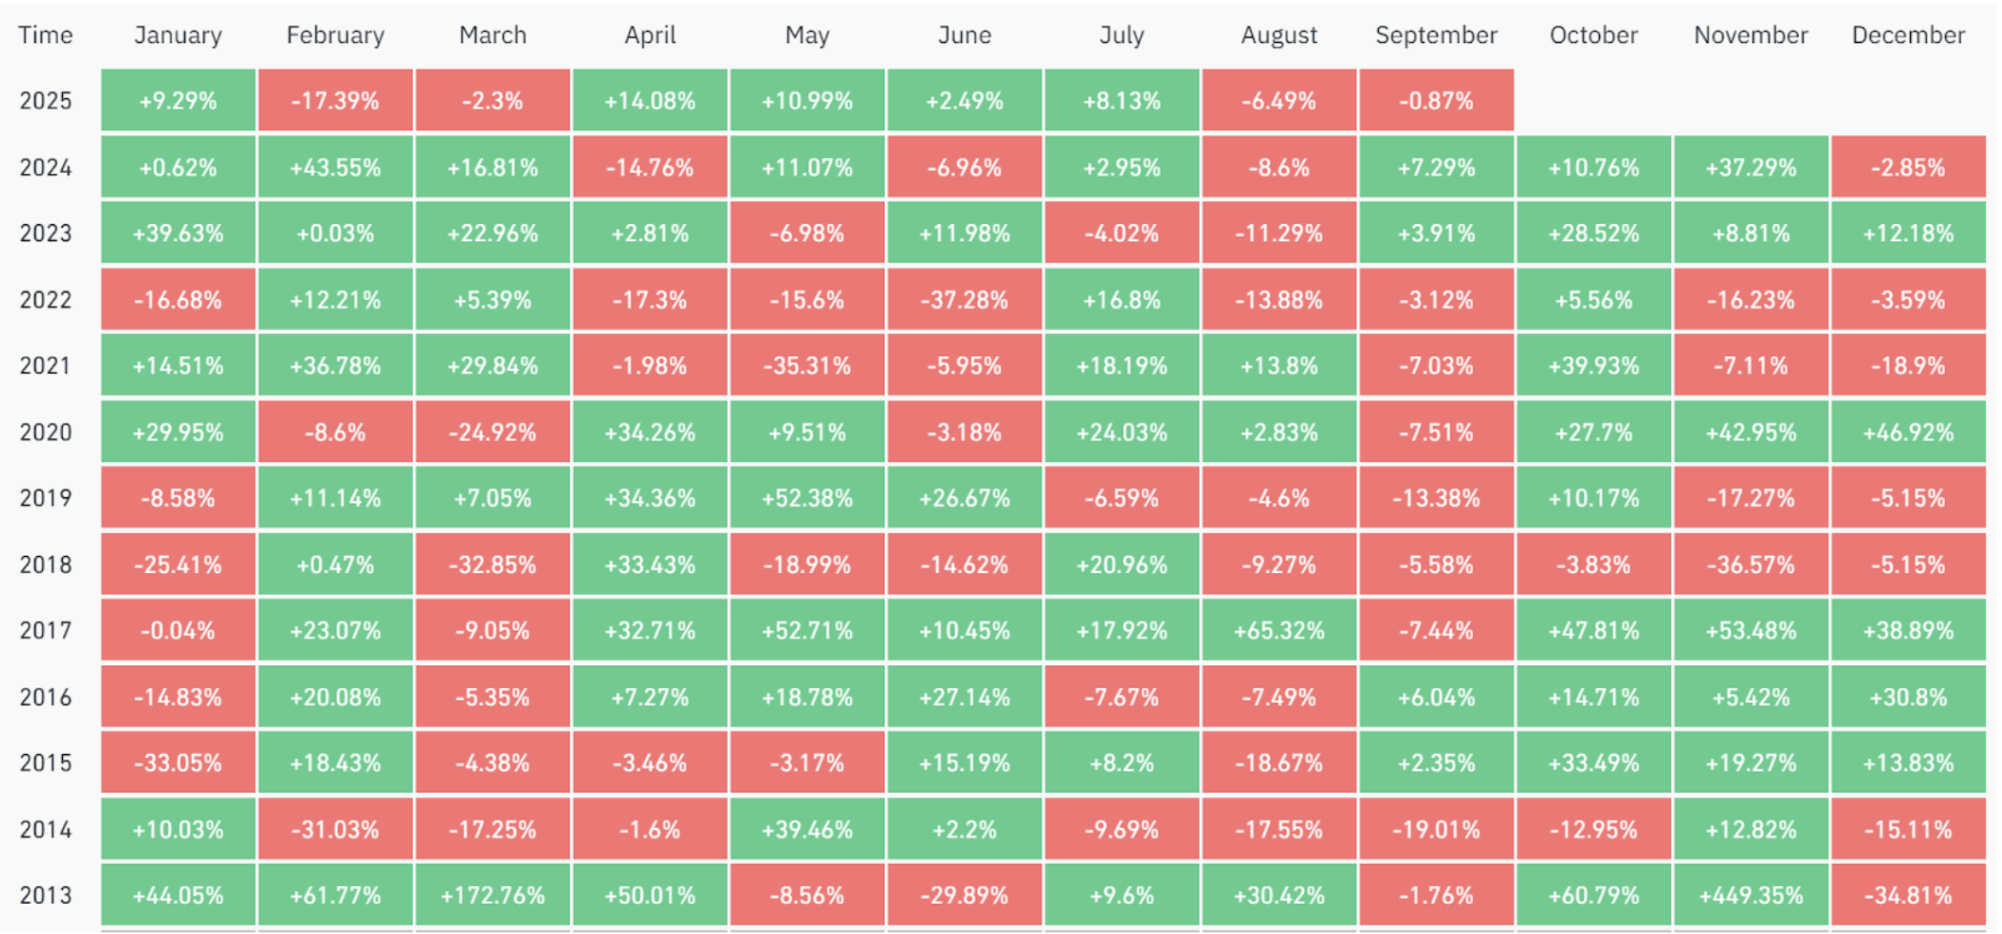
Historical BTC Performance | CoinGlass
Strong BTC and ETH performance, declining Bitcoin dominance, rising dollar liquidity through USDT and USDC issuance, and growing interest in liquid altcoins all point to one conclusion: the bull cycle is still ongoing, but in a different configuration. In this review, we’ll break down in detail how August shaped the market, what drivers fueled its dynamics, and what to expect as we head into the fall season.
Stablecoin Growth in August
August turned out to be one of the most notable months for the stablecoin market. The combined market cap of major players in the sector expanded by more than $14 billion, signaling a significant increase in dollar liquidity and growing investor confidence in digital dollar assets.
Tether (USDT) expanded issuance from $163.7B to $167.4B (+$3.7B). Most of the growth came in the second half of the month, including multiple $1B tranches on Ethereum.
USDC (USDC) showed even stronger momentum, with market cap rising from $64B to $70B (+$6B, nearly +10% in a single month). This was one of the largest monthly increases for USDC in recent years and reflects a resurgence of institutional interest.
Ethena USDe (USDE) continued rapid expansion, adding nearly $3.8B, from $8.5B to $12.3B. USDe’s success is tied to its algorithmic model, which offers the market a new version of a “decentralized dollar.” You can find a detailed breakdown of the Ethena project and the mechanics of its stablecoin in our separate review.
Altogether, stablecoin market cap growth in August exceeded $13–14B. The surge in issuance and broader dollar liquidity provides strong support for the market, even amid the ongoing correction.
At the same time, the market continues to face security challenges. In August, a 51% attack on a major PoW blockchain demonstrated that even theoretically unlikely risks can materialize, highlighting the coexistence of institutional capital flows and technical vulnerabilities within the same market environment.
The 51% Attack on Monero: A Signal for the Entire Industry
On August 12, Qubic, a company founded by a co-creator of IOTA, gained control of more than 51% of Monero’s hash rate, effectively dictating mining rules for several hours. For years, majority attacks were considered a threat mainly to smaller blockchains – but now, even a network with a $5B+ market cap has proven vulnerable.
Within just four hours, Qubic mined 63 out of 122 blocks, securing effective dominance. While no double-spend transactions were recorded, the blockchain reorganization showed that the risk is no longer theoretical. A majority attack allows reordering of transactions, chain reorgs, and double-spend attempts, though it does not enable the creation of new coins or direct theft of funds.
This incident highlighted that the high cost of attack is no longer a guarantee of security for PoW networks, as computing power can be rapidly redirected between tasks, including mining. For Monero, the situation is particularly serious given regulatory pressure and delistings from major exchanges – even without direct financial losses, network trust has been eroded. In the broader context, the attack raises serious questions about the resilience of PoW blockchains in general. Monero became the first major warning signal, underscoring the need to further decentralize hash rate and implement stronger protective mechanisms.
Despite these challenges, leading assets continued to show price action reflecting a balance between demand, correction, and capital inflows. Let’s take a closer look at how these factors played out in Bitcoin’s price dynamics throughout August.
Bitcoin Performance in August
In our July market review, we noted that after setting a new all-time high, Bitcoin did not enter a deep correction but instead moved into a consolidation phase. This pattern suggested not exhaustion but rather preparation for another upward move. And indeed, in the first half of August, Bitcoin once again demonstrated strength.
The month began with a brief correction: by August 2, BTC had pulled back to around $112,000, after which a sharp bullish impulse followed. By August 14, Bitcoin had set a new all-time high at $124,474, marking an 11% increase from the local low. However, the momentum could not be sustained. The second half of the month was dominated by downside pressure, and by the end of August Bitcoin had declined to around $108,200, which is 6.5% lower than the monthly open. This once again confirmed the historically negative seasonality of August.
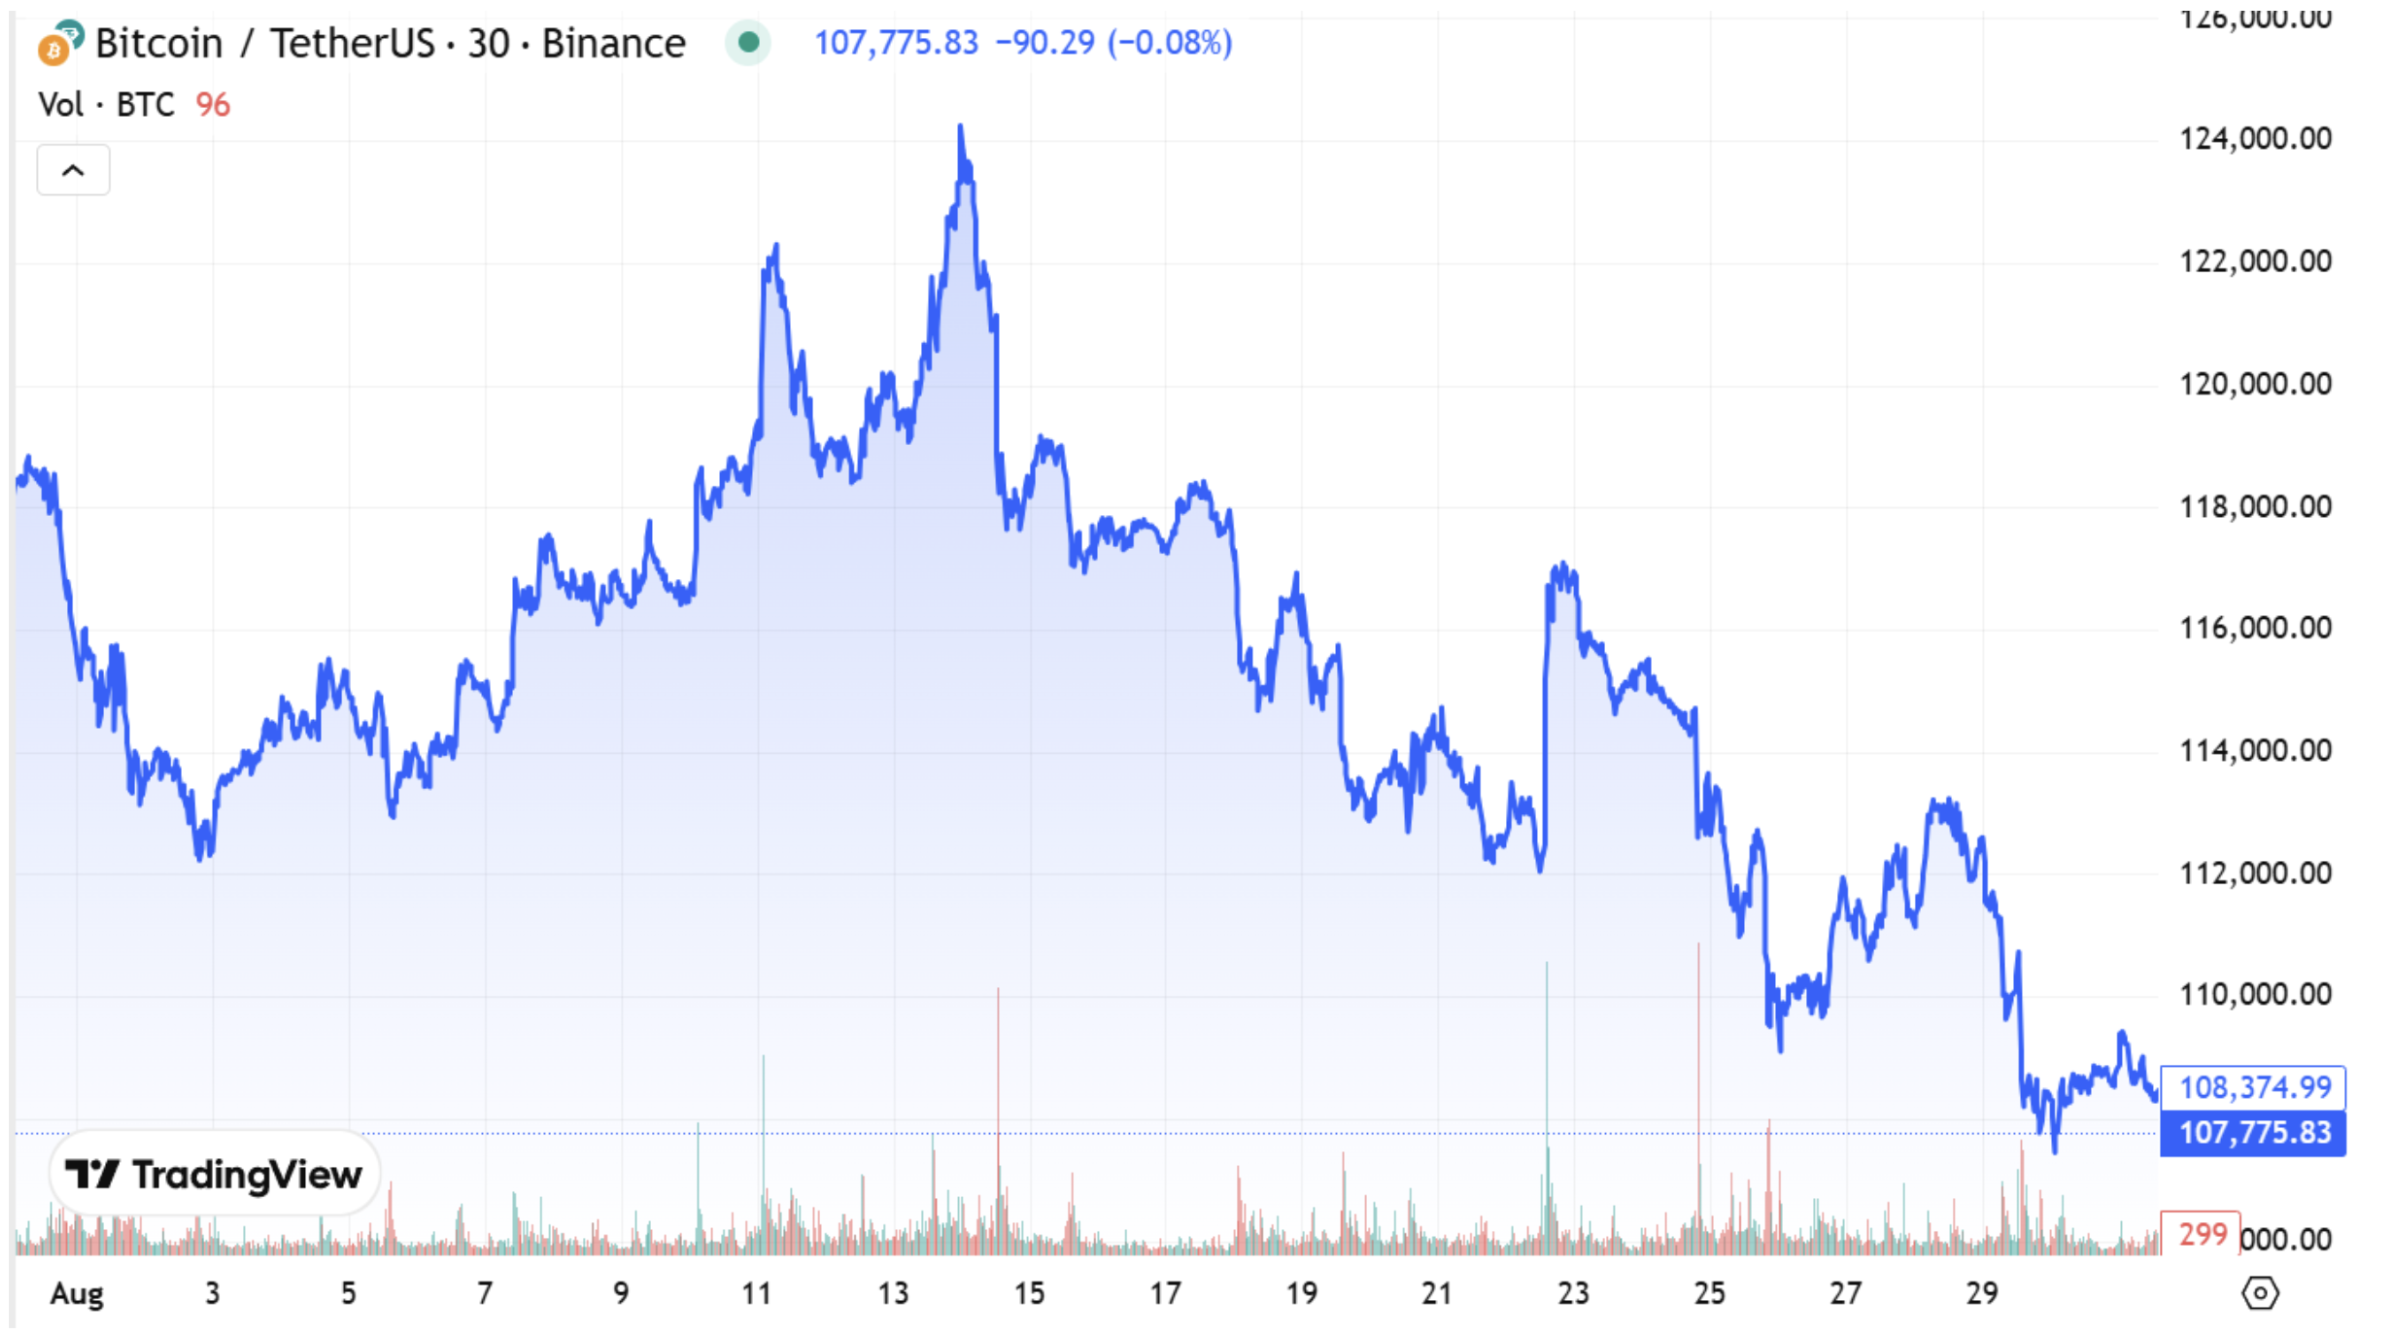
Bitcoin (BTC) Chart. Source: Cryptorank
Bitcoin ETF Inflows
One of the key drivers of the current cycle remains inflows into spot Bitcoin ETFs. Over recent months, they have been the main growth catalyst, providing steady demand. However, since the second half of July, the pace of inflows has noticeably slowed.
This trend continued into August. Temporary surges of interest appeared during periods when Bitcoin reached new ATHs, driven largely by FOMO buying, but overall flows lacked a clear directional bias. The histogram below shows that the balance between inflows and outflows remained in a neutral zone.
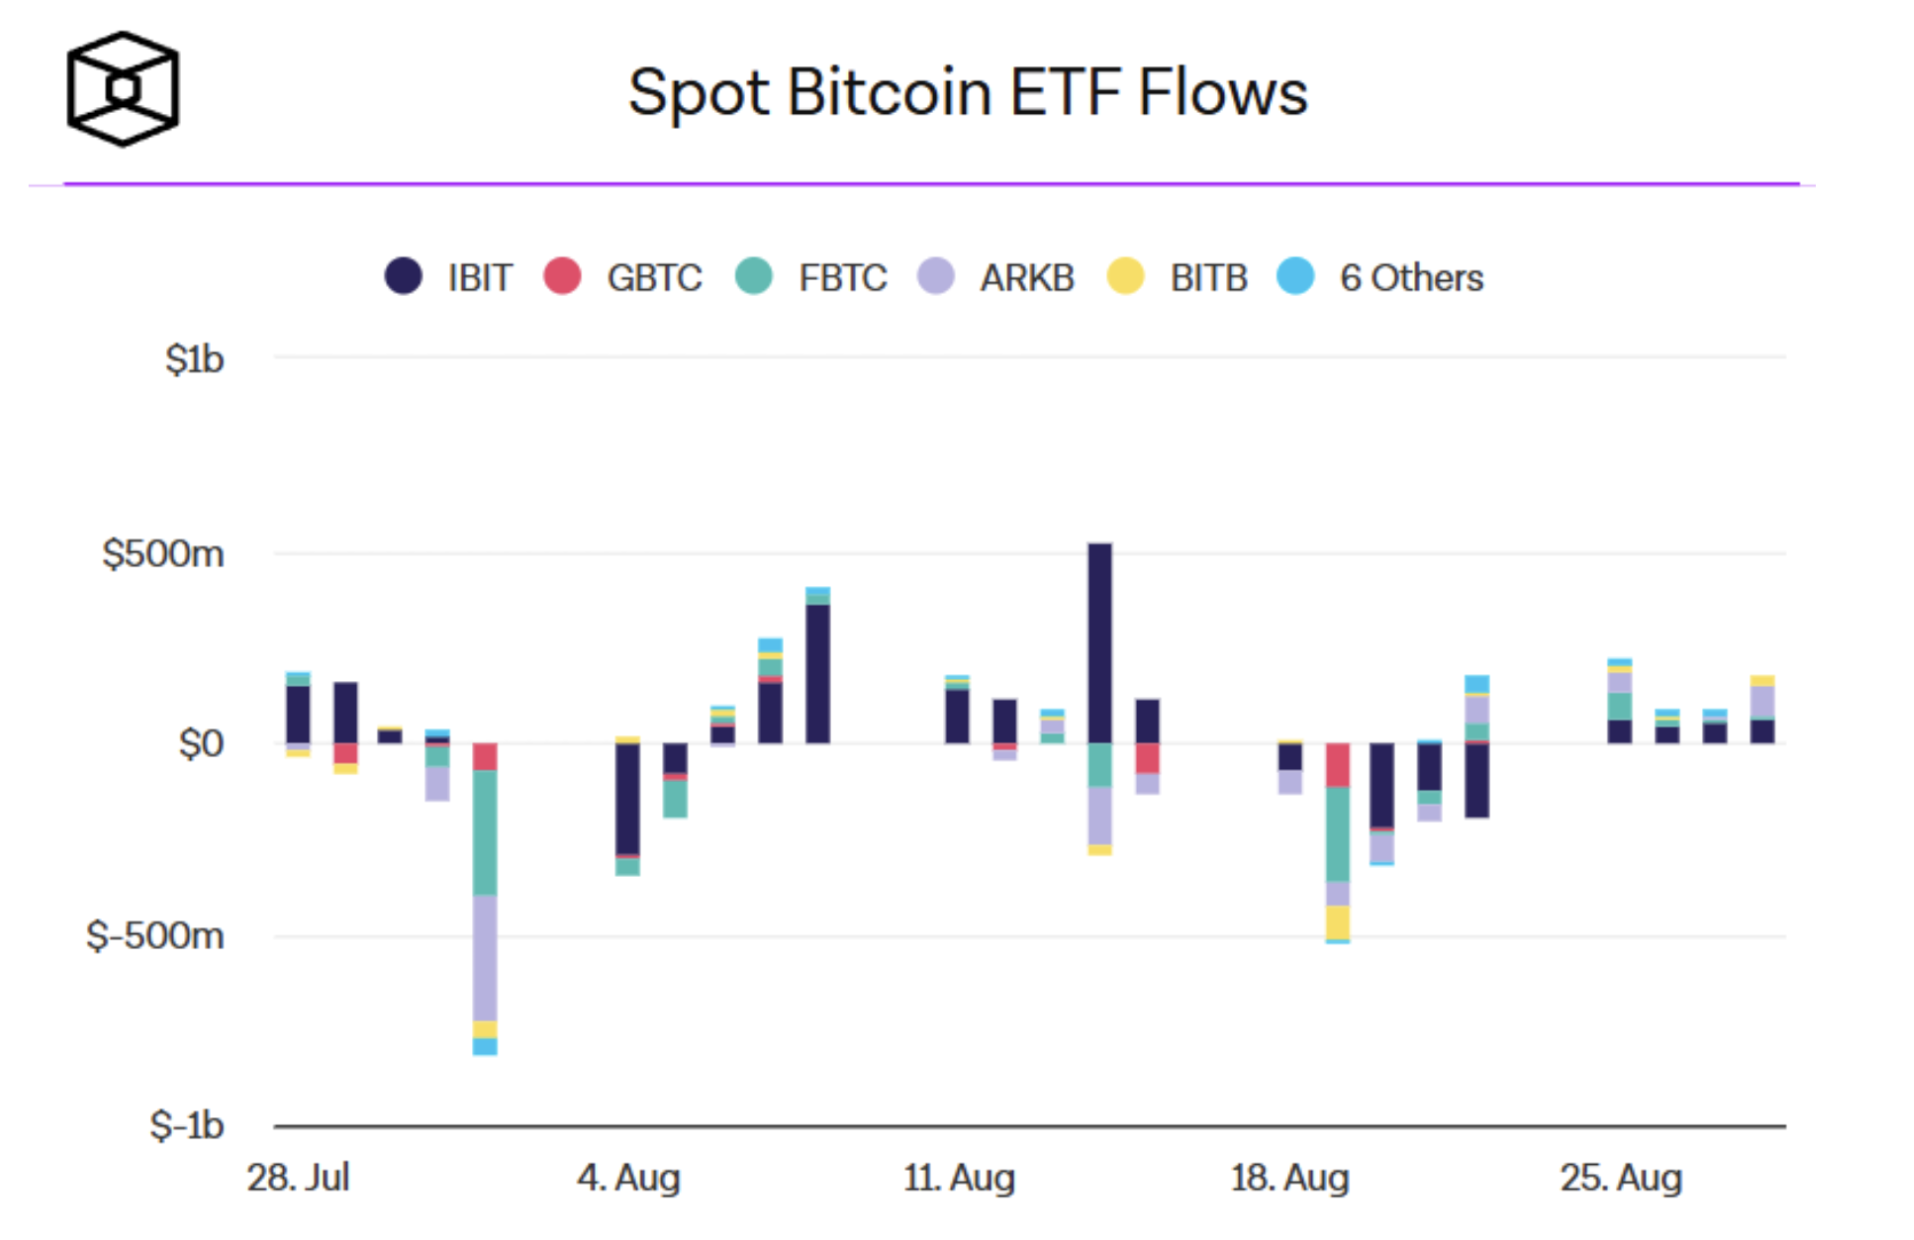
Spot Bitcoin ETF Flows. Source: The Block
At this stage, the slowdown is not a sign of structural weakness but rather an indicator of a temporary pause. Yet, in such phases, even a small shift in ETF flow dynamics can act as a trigger:
Renewed inflows could push Bitcoin toward fresh highs.
Outflows could accelerate the correction.
While BTC price action remains closely tied to the balance of ETF flows, part of the liquidity has been steadily rotating into Ethereum, which has become the primary beneficiary of recent months.
Ethereum Performance in August
After the explosive rally in July – when ETH posted its strongest monthly performance since the 2021 bull market – the asset continued to strengthen in August. The month opened with a moderate correction, with a local low of $3,354 recorded on August 3, from which Ethereum resumed its upward trajectory.
At its peak on August 24, ETH set a new all-time high at $4,956. Toward the end of the month, however, profit-taking followed, and the August monthly candle closed at $4,391. This marked a +18.75% monthly gain, while Bitcoin closed the month in the red. From the monthly low to the new ATH, ETH achieved an impressive +47.7% rally.
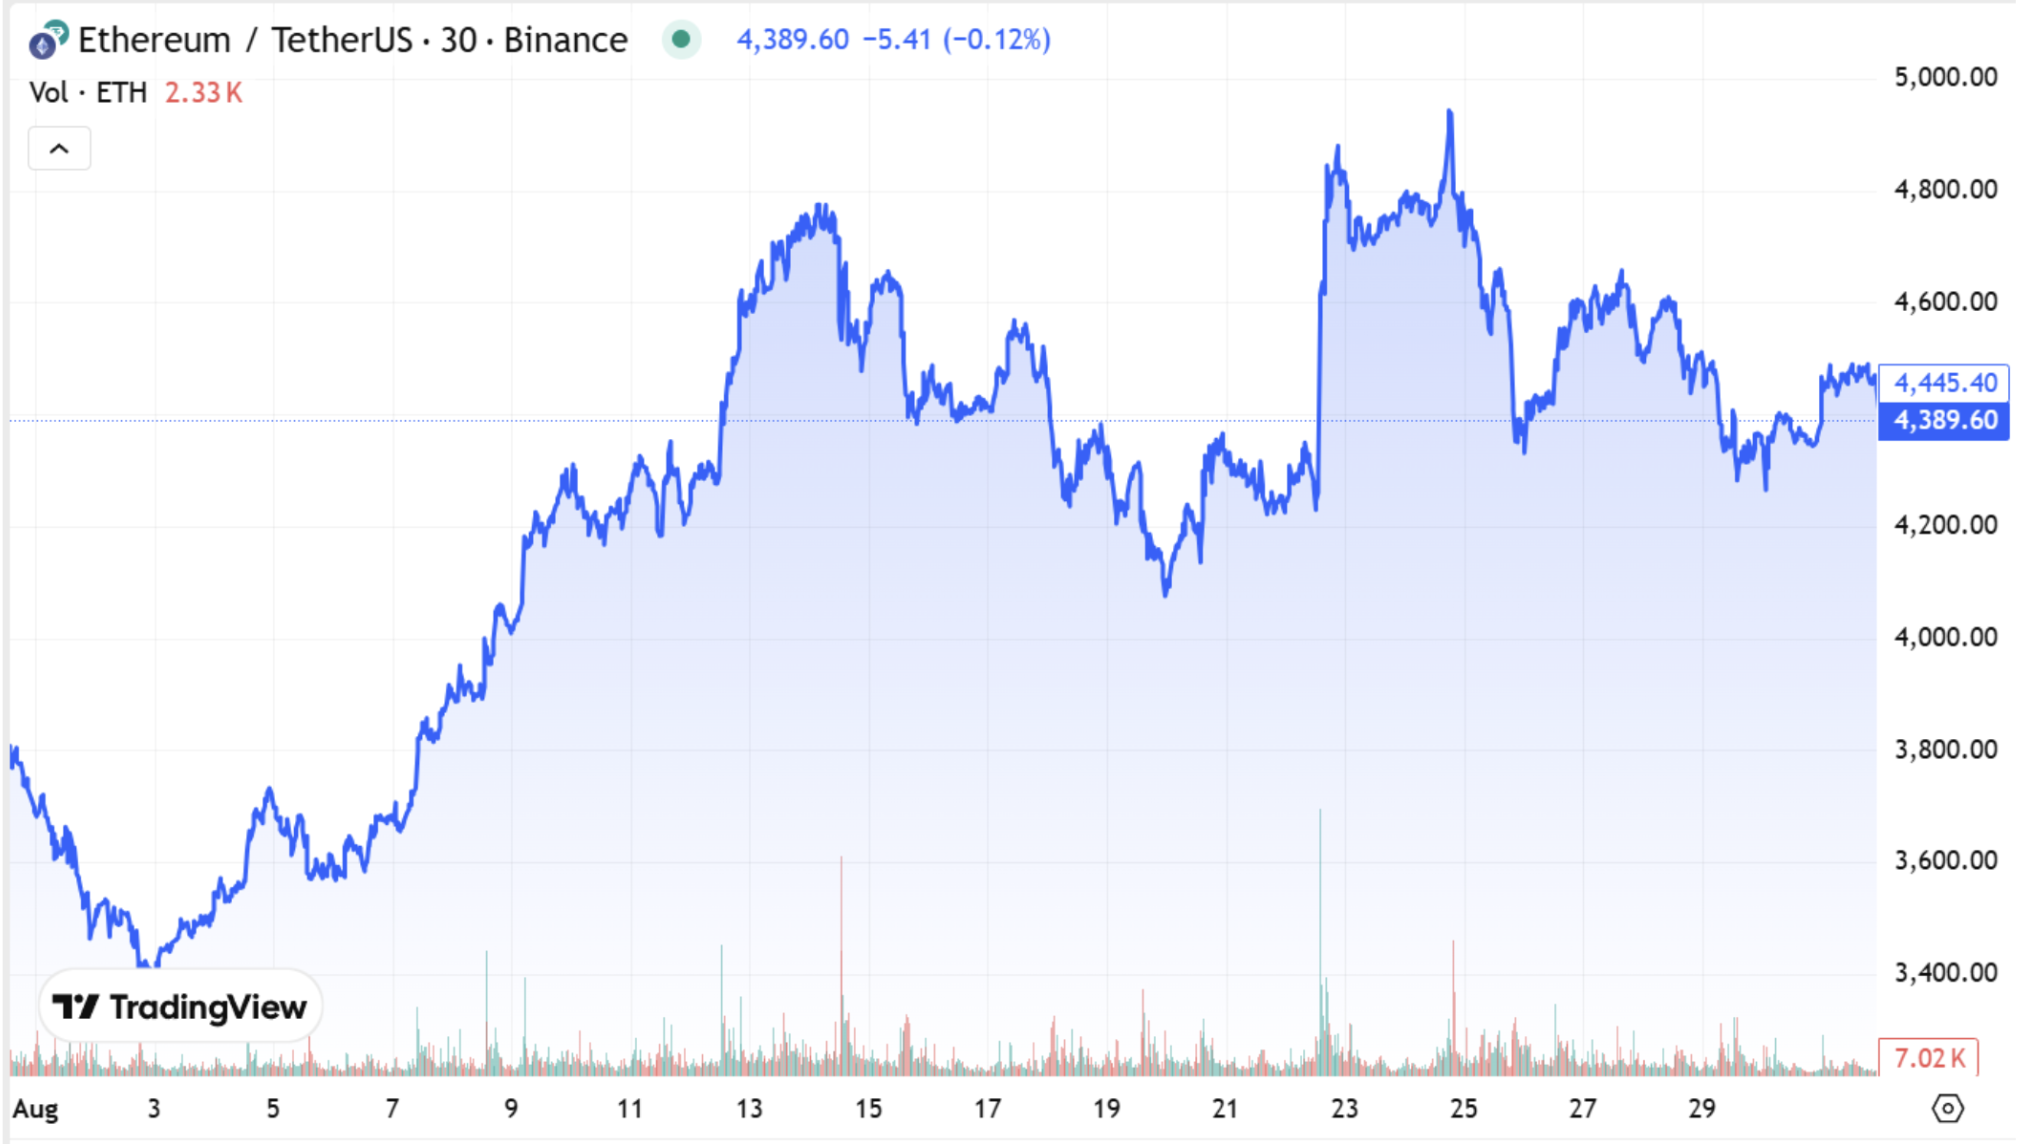
Ethereum (ETH) Chart. Source: Cryptorank
Ethereum ETF Inflows
The key driver of Ethereum’s rally was large-scale inflows into spot ETH ETFs, which amplified institutional demand for the asset. Unlike Bitcoin – where flows in August remained balanced – Ethereum flows looked much stronger.
Already in July, inflows into ETH ETFs had reached record levels since the instruments launched, and in the second half of the month, they even surpassed inflows into BTC ETFs, signaling a major shift in institutional focus. In August, this trend only strengthened, with the flow histogram clearly showing ETH’s growing advantage.
In effect, this confirms that Ethereum is no longer seen by the market as a “secondary altcoin.” It is steadily establishing itself as a core institutional asset, not just a technological project.
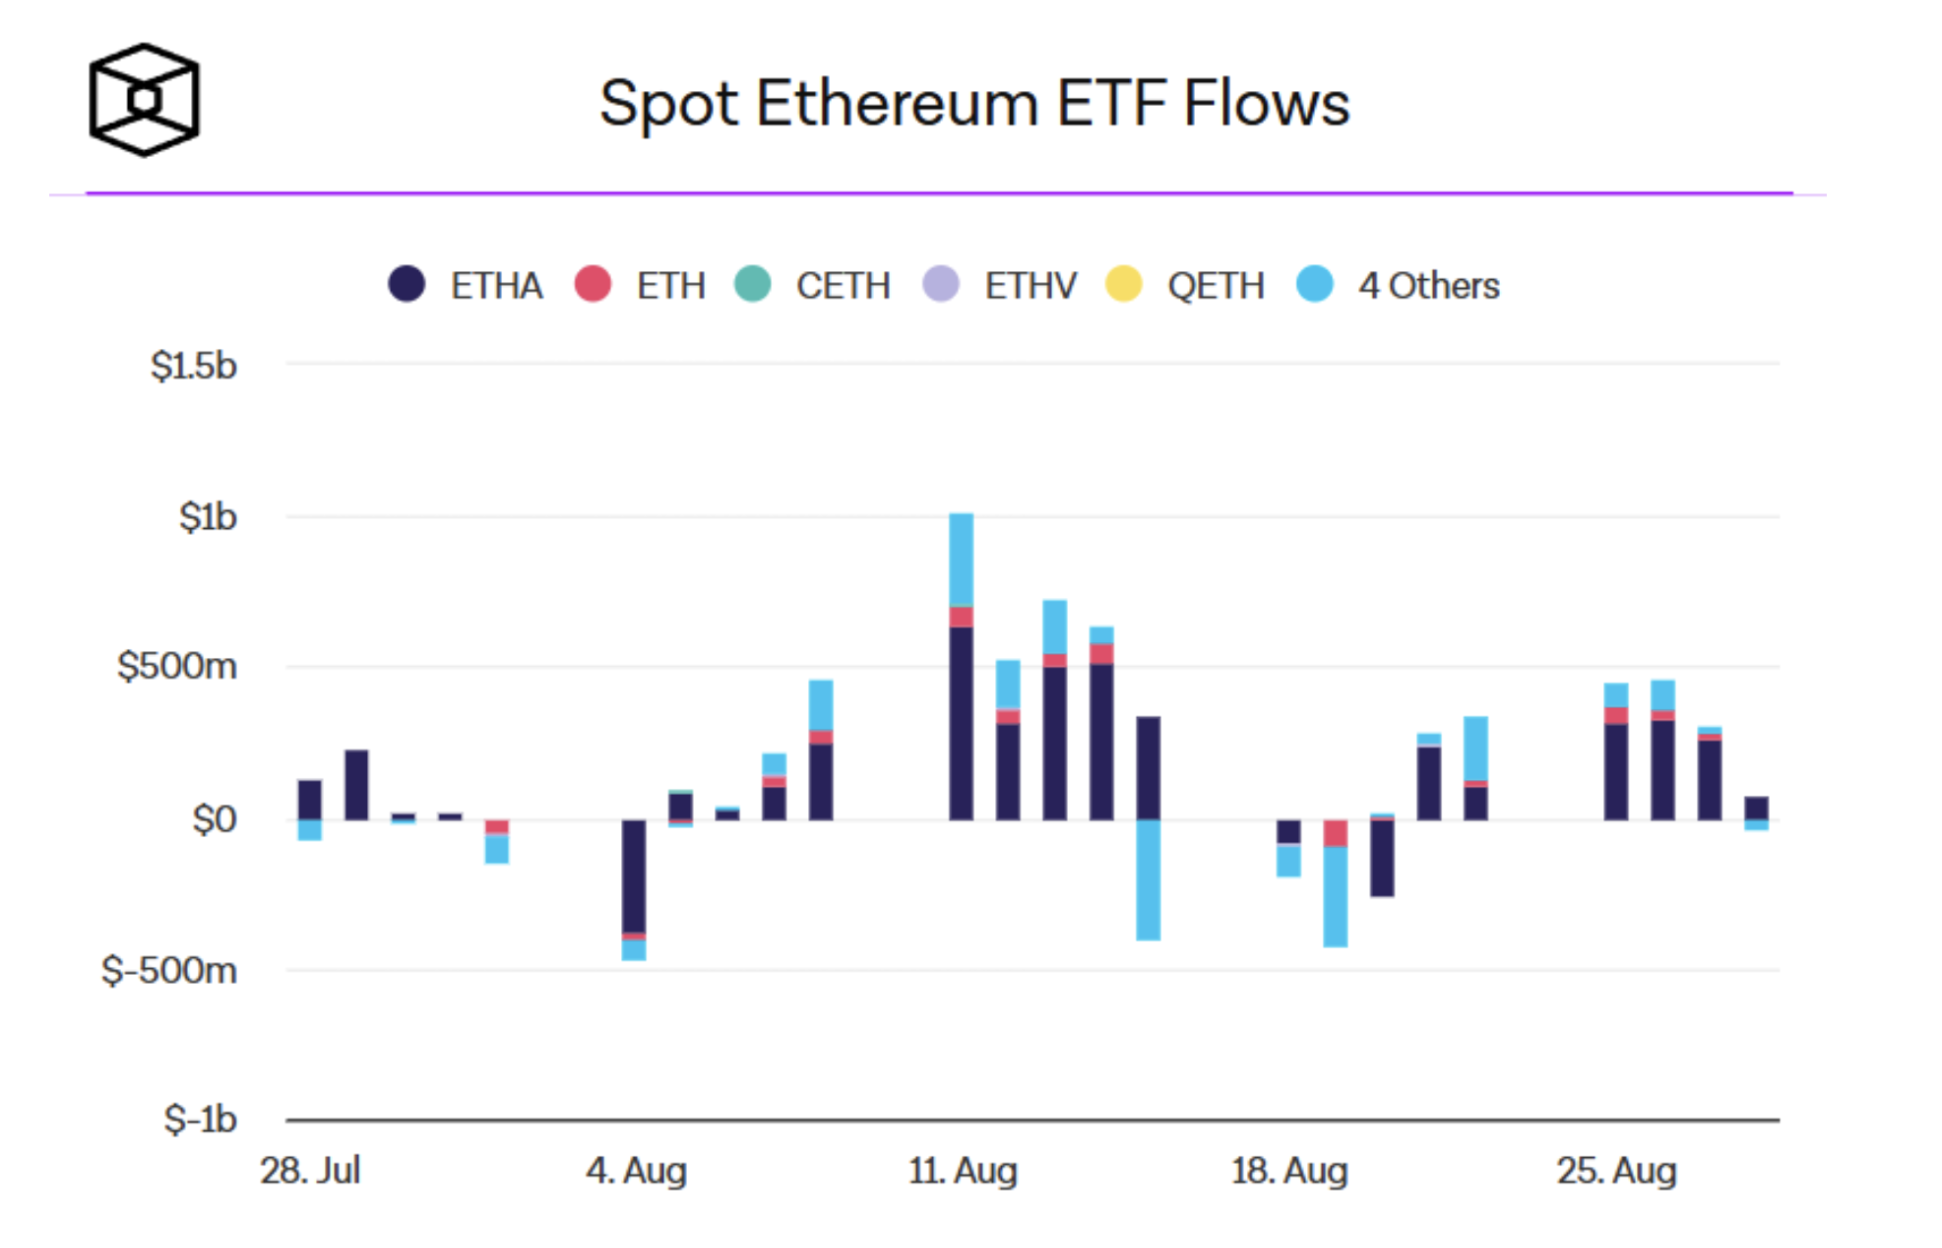
Spot Ethereum ETF Flows. Source: The Block
August highlighted the opposite dynamics of the two key market assets. Bitcoin slowed down, while Ethereum, fueled by ETF inflows, continued to rally. These are not isolated events but part of a broader liquidity rotation within the crypto market.
We regularly cover Ethereum’s role not only in market reviews but also in our blog. To mark the network’s 10-year anniversary, we prepared a special article explaining why Ethereum has already moved beyond being “just a cryptocurrency” and is becoming the foundation of a new financial architecture.
To fully grasp the scale of these structural shifts, let’s now turn to the main indicators of capital rotation: BTC dominance and the ETH/BTC trading pair.
BTC Dominance & ETH/BTC Pair
In August, the market continued to follow the scenario we outlined back in our May review. After Bitcoin’s growth phase, a gradual capital rotation began. As in previous cycles, ETH was the first asset to attract liquidity away from BTC. Historically, the rise of the ETH/BTC pair has been the earliest signal of a market phase shift – this was the case in both 2017 and 2021.
We are now seeing confirmation of this pattern. Over just two months, ETH gained more than 90% against BTC, rising from 0.022 to 0.043, breaking through key resistance levels and consolidating above them. This solidified Ethereum’s role as the second major capital magnet in the market.
At the same time, Bitcoin dominance (BTC.D) fell sharply, from 66% down to 58%. This significant shift reflects the beginning of capital rotation, as investors lock in Bitcoin profits and move into assets with higher potential upside.
On the combined chart below, it is clearly visible how the rise in ETH/BTC coincides with the decline in BTC.D. These two indicators synchronously confirm a phase transition in the market. Capital is moving beyond Bitcoin, and if historical patterns hold, the market may soon enter a full-fledged altseason.
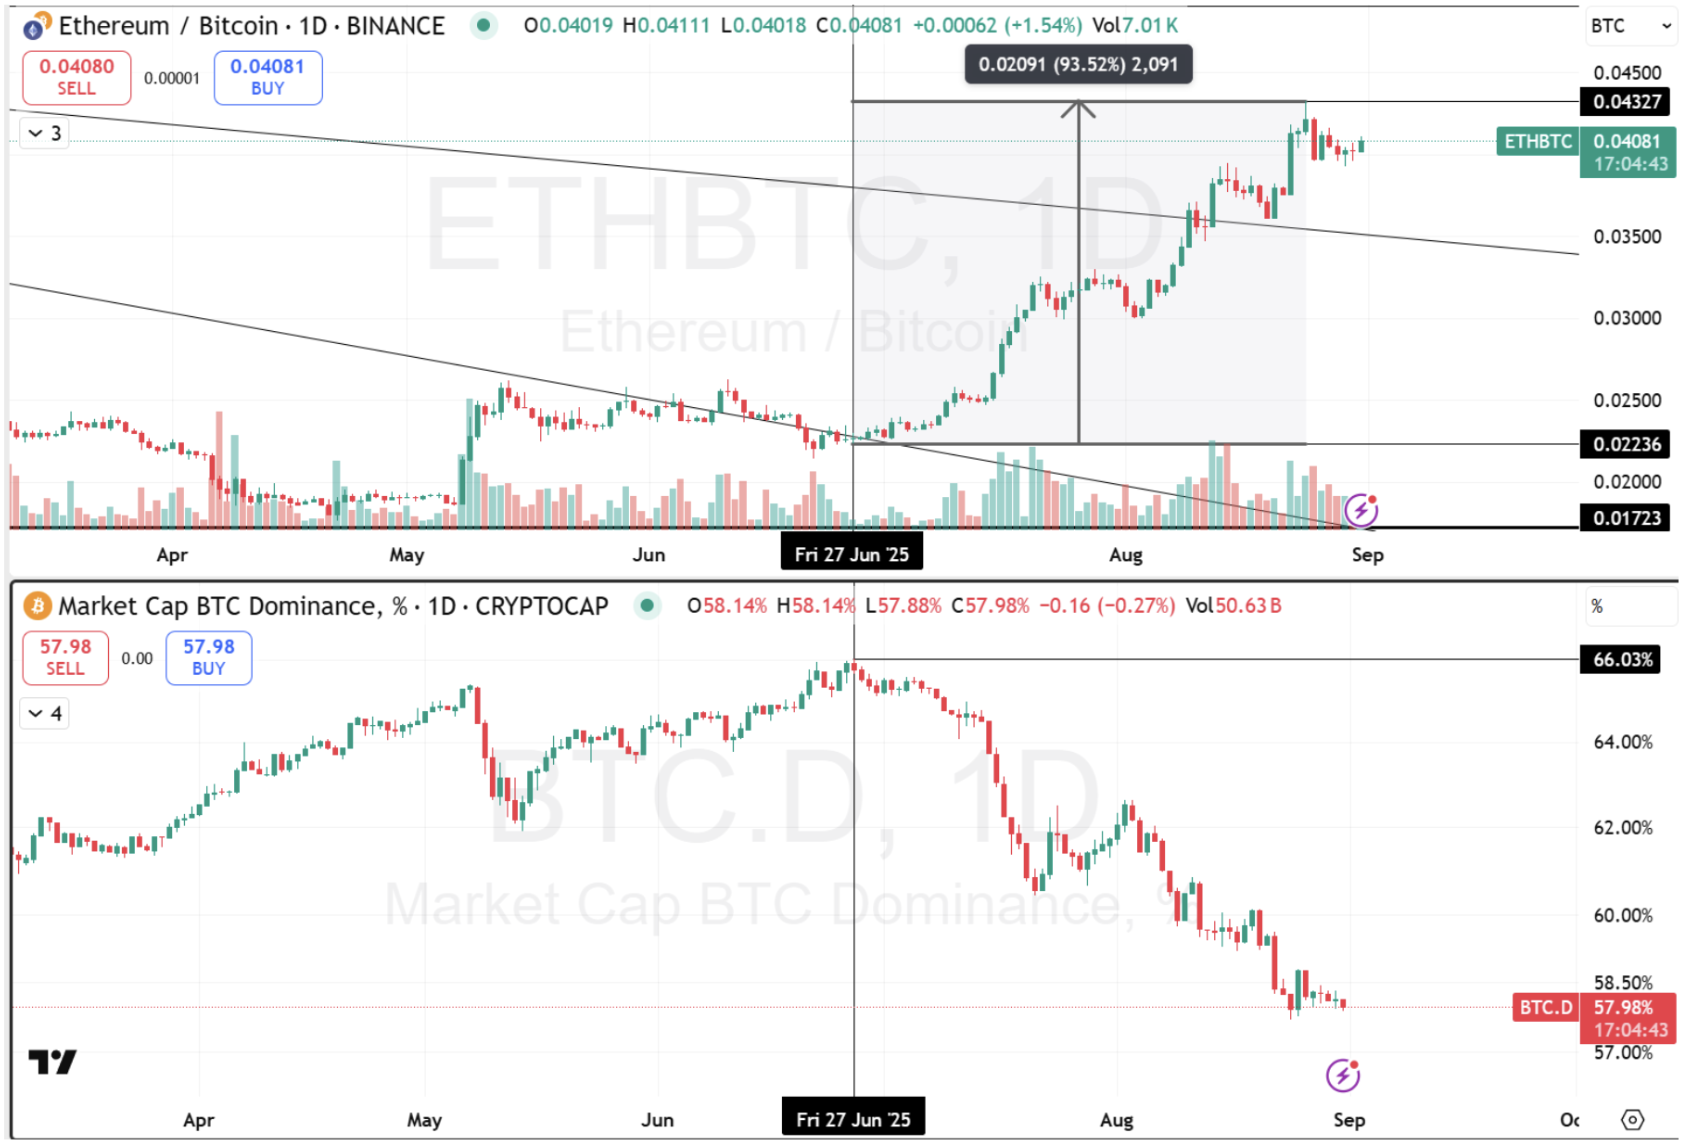
ETH/BTC & Market Cap BTC Dominance. Source: TradingView
Altseason in 2025?
The history of the crypto market shows that after Bitcoin and Ethereum expansion phases, a period follows when capital begins to actively flow into higher-risk assets. This stage is known as altseason. During such periods, dozens of altcoins can surge by hundreds or even thousands of percent within weeks, turning the market into a modern-day gold rush.
The classic cycle has repeated multiple times: first, Bitcoin rallies and absorbs liquidity, then attention shifts to Ethereum, and afterward comes a broad altcoin rally. This was the case in both 2017 and 2021.
In 2025, similar conditions are forming. After setting new highs, Bitcoin has started to give up some liquidity, its dominance has dropped from 66% to 58%, and Ethereum is steadily strengthening its position. These factors suggest the market may be standing at the threshold of a new altseason.
However, the industry has evolved. In past cycles, the main drivers were L1s, DeFi, and meme coins, but today new segments are emerging: RWA, LSDFi, AI, DePIN, ZK. On top of that, institutional investors have entered the market, ETFs are live, and regulatory pressure is increasing. All of this could reshape the character of the upcoming altseason – it could be loud and “wild,” or more measured and institutional, with selective growth across specific sectors.
You can read more about altseason scenarios and strategies in a dedicated article on our blog.
Trading Activity & Volume
After the market reversal in July – when total spot trading volume on centralized exchanges surged to $1.77T (+70% vs. June, the highest in the past 4 months) – August reinforced the positive momentum. Overall volumes reached $1.82T, surpassing July’s result.
The histogram below shows that the traditionally “weak summer” failed to materialize. Instead, seasonality was broken, reflecting a revival of interest from both retail traders and institutions. CEX volumes confirm that the market is waking up – this is not just a local technical rebound but the beginning of a sustained activity phase.
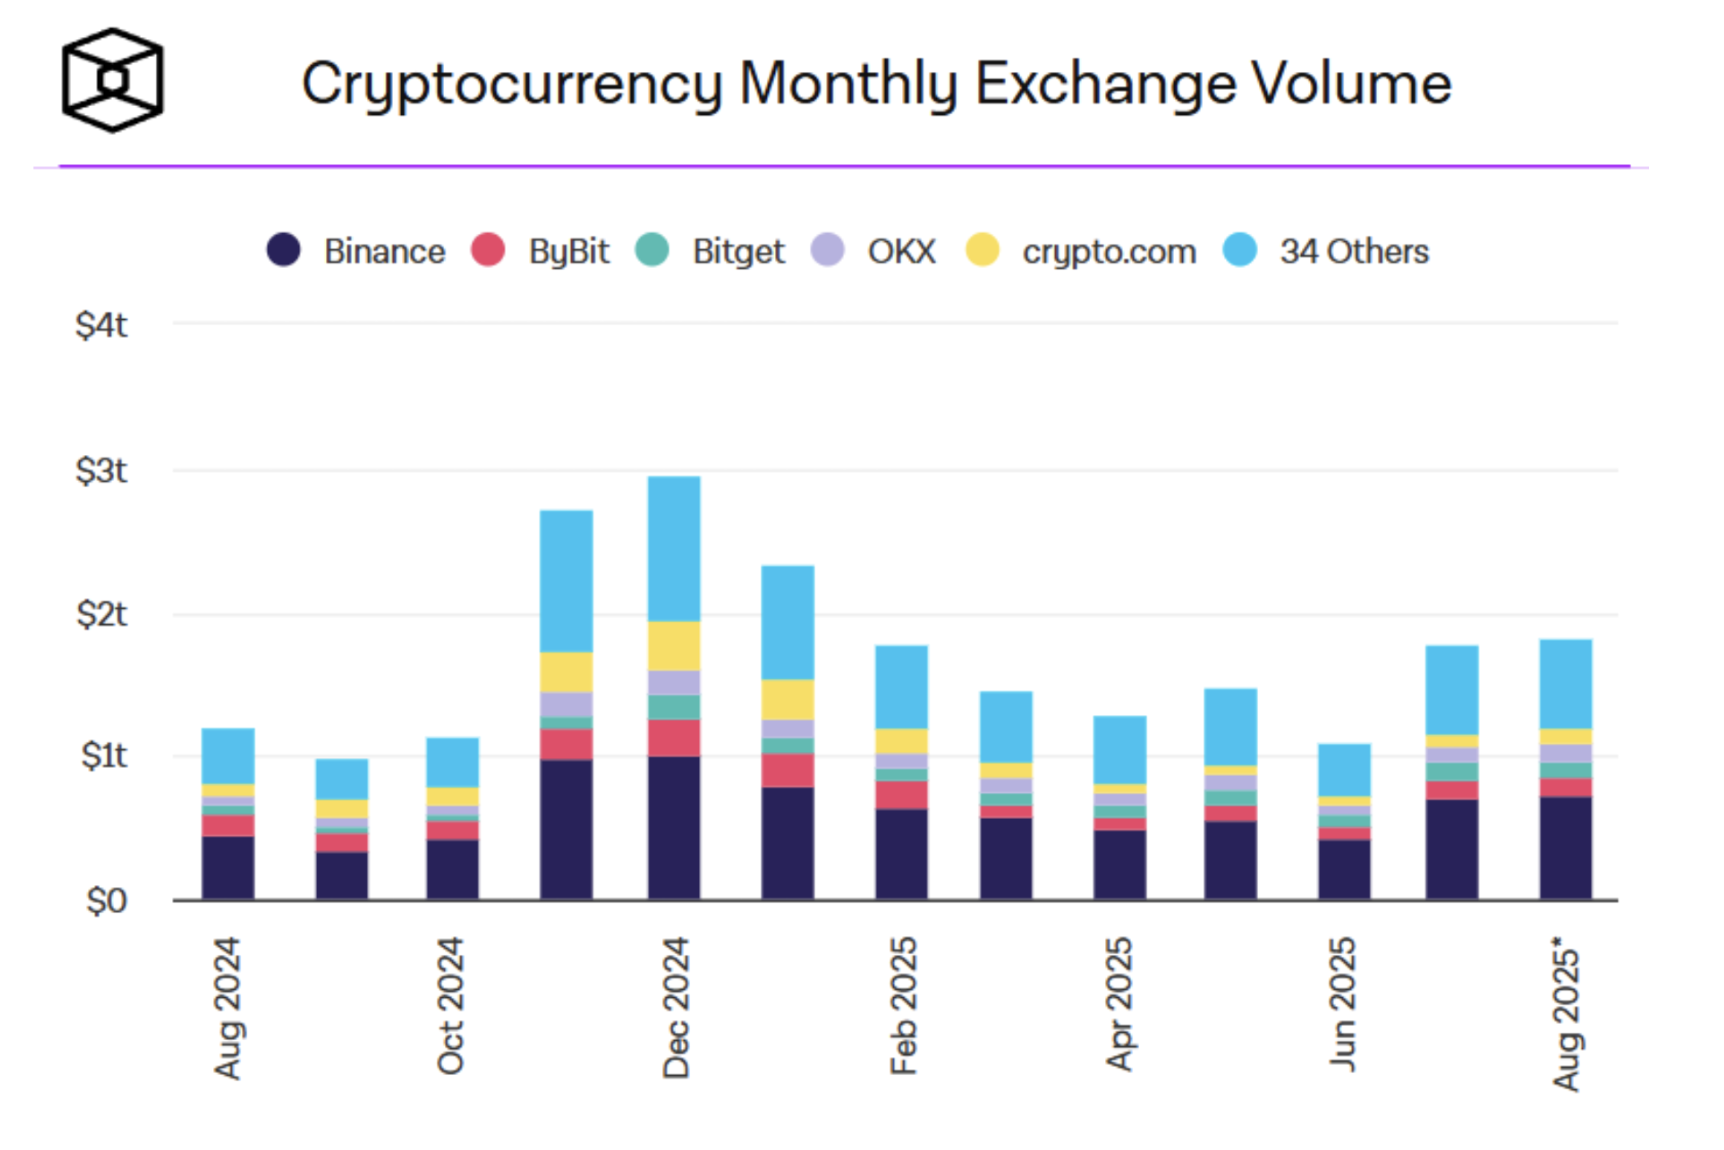
Spot Trading Volume on CEX. Source: The Block
Trading volumes on decentralized exchanges in August hit $363B, the second-highest level in the past year. This growth was fueled by several factors: improved UX, lower fees, faster networks, and rising trust in protocols.
What’s especially notable is that both DEX and CEX volumes grew simultaneously. This shows it’s not simply a matter of liquidity migrating between venues – rather, it signals a system-wide market awakening, spanning all levels from funds and professional traders to retail investors.
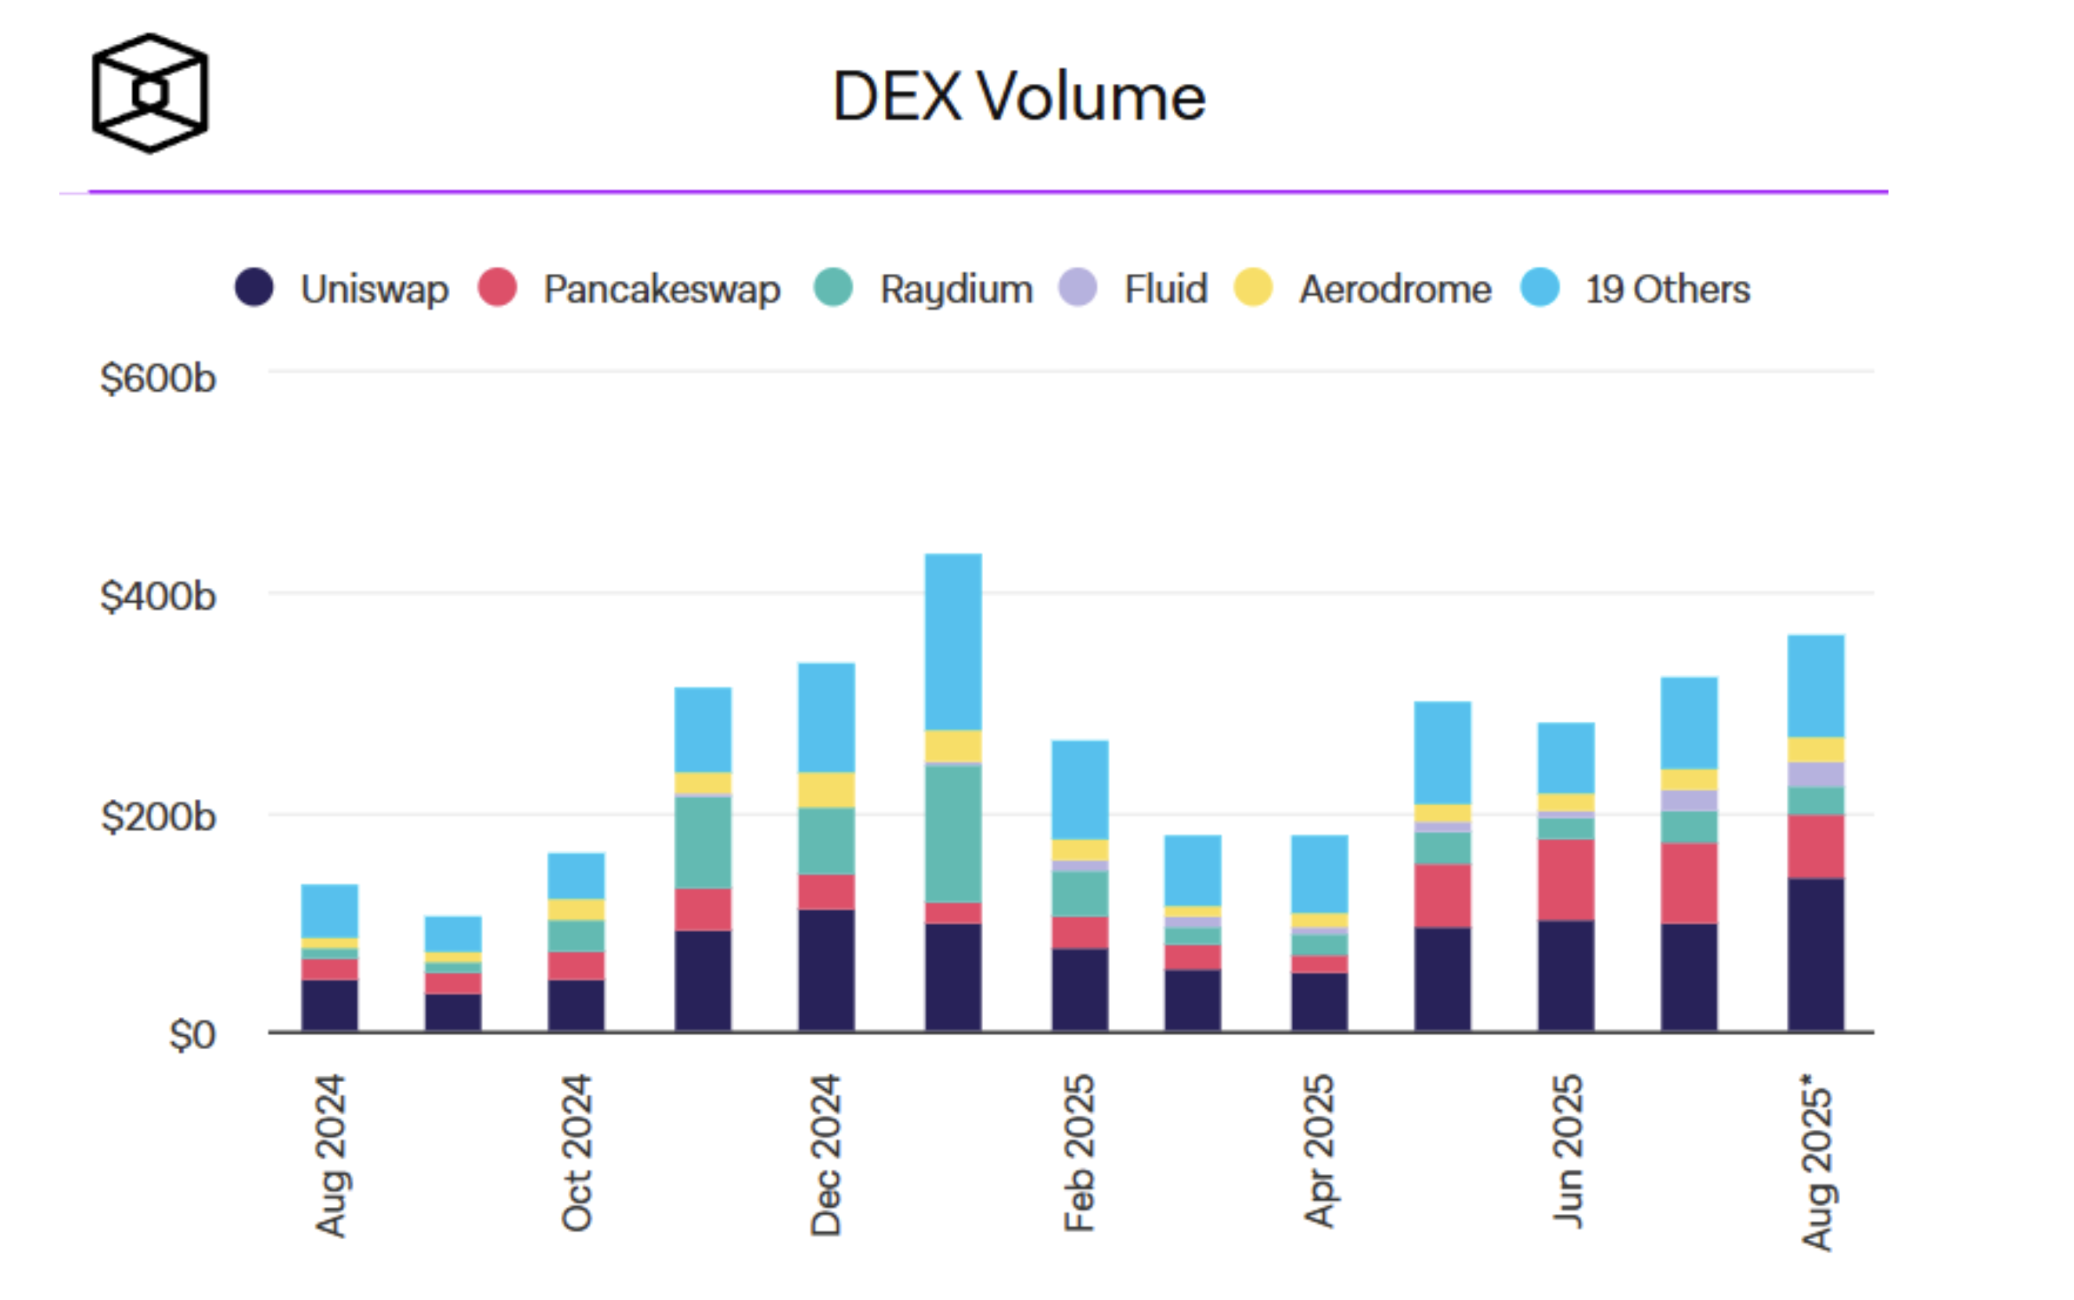
Spot Trading Volume on DEX. Source: The Block
Top Gainers & Losers
August confirmed the trend of growing investor interest beyond BTC and ETH. Among the top performers were projects from different niches – from meme coins to infrastructure solutions. This signals that the market is gradually shifting into a phase of broader altcoin activity.
What’s especially notable is that three tokens posted gains of over 90–100%. In past cycles, such spikes were early indicators of a renewed risk-on appetite.
Top-5 Gainers of the Month:
OKB (OKB, +270%). The OKX exchange token surged following record-breaking burn volumes.
Cronos (CRO, +111%). Rallied on news that Trump’s company plans to acquire Cronos tokens.
MemeCore (M, +90%). A next-generation meme coin that gained traction from retail-driven hype.
Mantle (MNT, +63%). A Layer-2 solution built on EigenDA, boosted by ecosystem expansion and new integrations.
Pyth Network (PYTH, +61%). A Solana-based oracle provider, driven by news of a partnership with the U.S. Department of Commerce.
The absence of sectoral concentration suggests that the market is in a “story-hunting phase” – with capital testing different niches before the next major narrative emerges.
Top-5 Losers of the Month:
SPX6900 (SPX, -30%). An experimental cryptographic token that retraced after a short-lived speculative rally.
Fartcoin (FARTCOIN, -22%). A typical meme coin that quickly lost its hype-driven market cap.
Four (FORM, -22%). A GameFi platform that continued to decline amid waning gaming interest and low DAO activity.
Sky (SKY, -19%). A MakerDAO ecosystem token showing volatility during the migration from MKR.
XDC Network (XDC, -18%). An infrastructure project that lost ground due to weak network activity.
Losses were largely concentrated in hype-driven or transitional projects. There were no significant sell-offs in liquid altcoins, underscoring the market’s resilience and the localized nature of the correction – a trend further confirmed by August’s Google data.
Google Trends Analysis
In August, only top-100 CMC coins made it into Google Trends, showing that audience interest is concentrated on large-cap, established assets. The leaders remained the same: BTC and ETH.
Notably, three AMM projects – RAY, AERO, and CRV – appeared in the trends, pointing to a revival of interest in DeFi yield opportunities. Adding IoT-related tokens and meme coins to the mix produces the classic setup that historically preceded the start of risk-on phases.
Historically, altcoin rallies have followed this chain of events:
BTC rally
ETH rally
Decline in BTC dominance
Search for top alts in Google Trends
DeFi, meme coins, and IoT projects enter the spotlight
Impulse move in altcoins begins
The current dynamics suggest the market is gradually preparing for an altcoin impulse, with Google Trends serving as an early indicator of this process.
Market Sentiment in August
Throughout most of August, the Fear & Greed Index remained in the neutral zone but slid into fear territory by the end of the month. The first half was marked by rallies in BTC and ETH, briefly pushing the index into greed, but that impulse proved short-lived.
The key distinction of the current cycle is that the market is rising without excessive euphoria. Even amid strong bullish catalysts – ETF inflows, new ETH all-time highs, and BTC pushing above $120K – investors remain cautious. Moreover, even short corrections are triggering disproportionately strong fear reactions. This reflects two main factors:
Uncertainty among participants about the long-term sustainability of the rally.
Retail fatigue, with many retail investors disillusioned and preferring to stay on the sidelines.
On one hand, this dynamic limits the potential for a rapid market blow-off. On the other, the absence of overheating provides a healthy foundation for the next impulse.
What’s especially important is that without altcoin participation, sentiment will not shift meaningfully. It is precisely altcoin rallies that historically ignite the euphoric phase and drive momentum across the entire market. For now, the market is balancing in anticipation of a trigger.
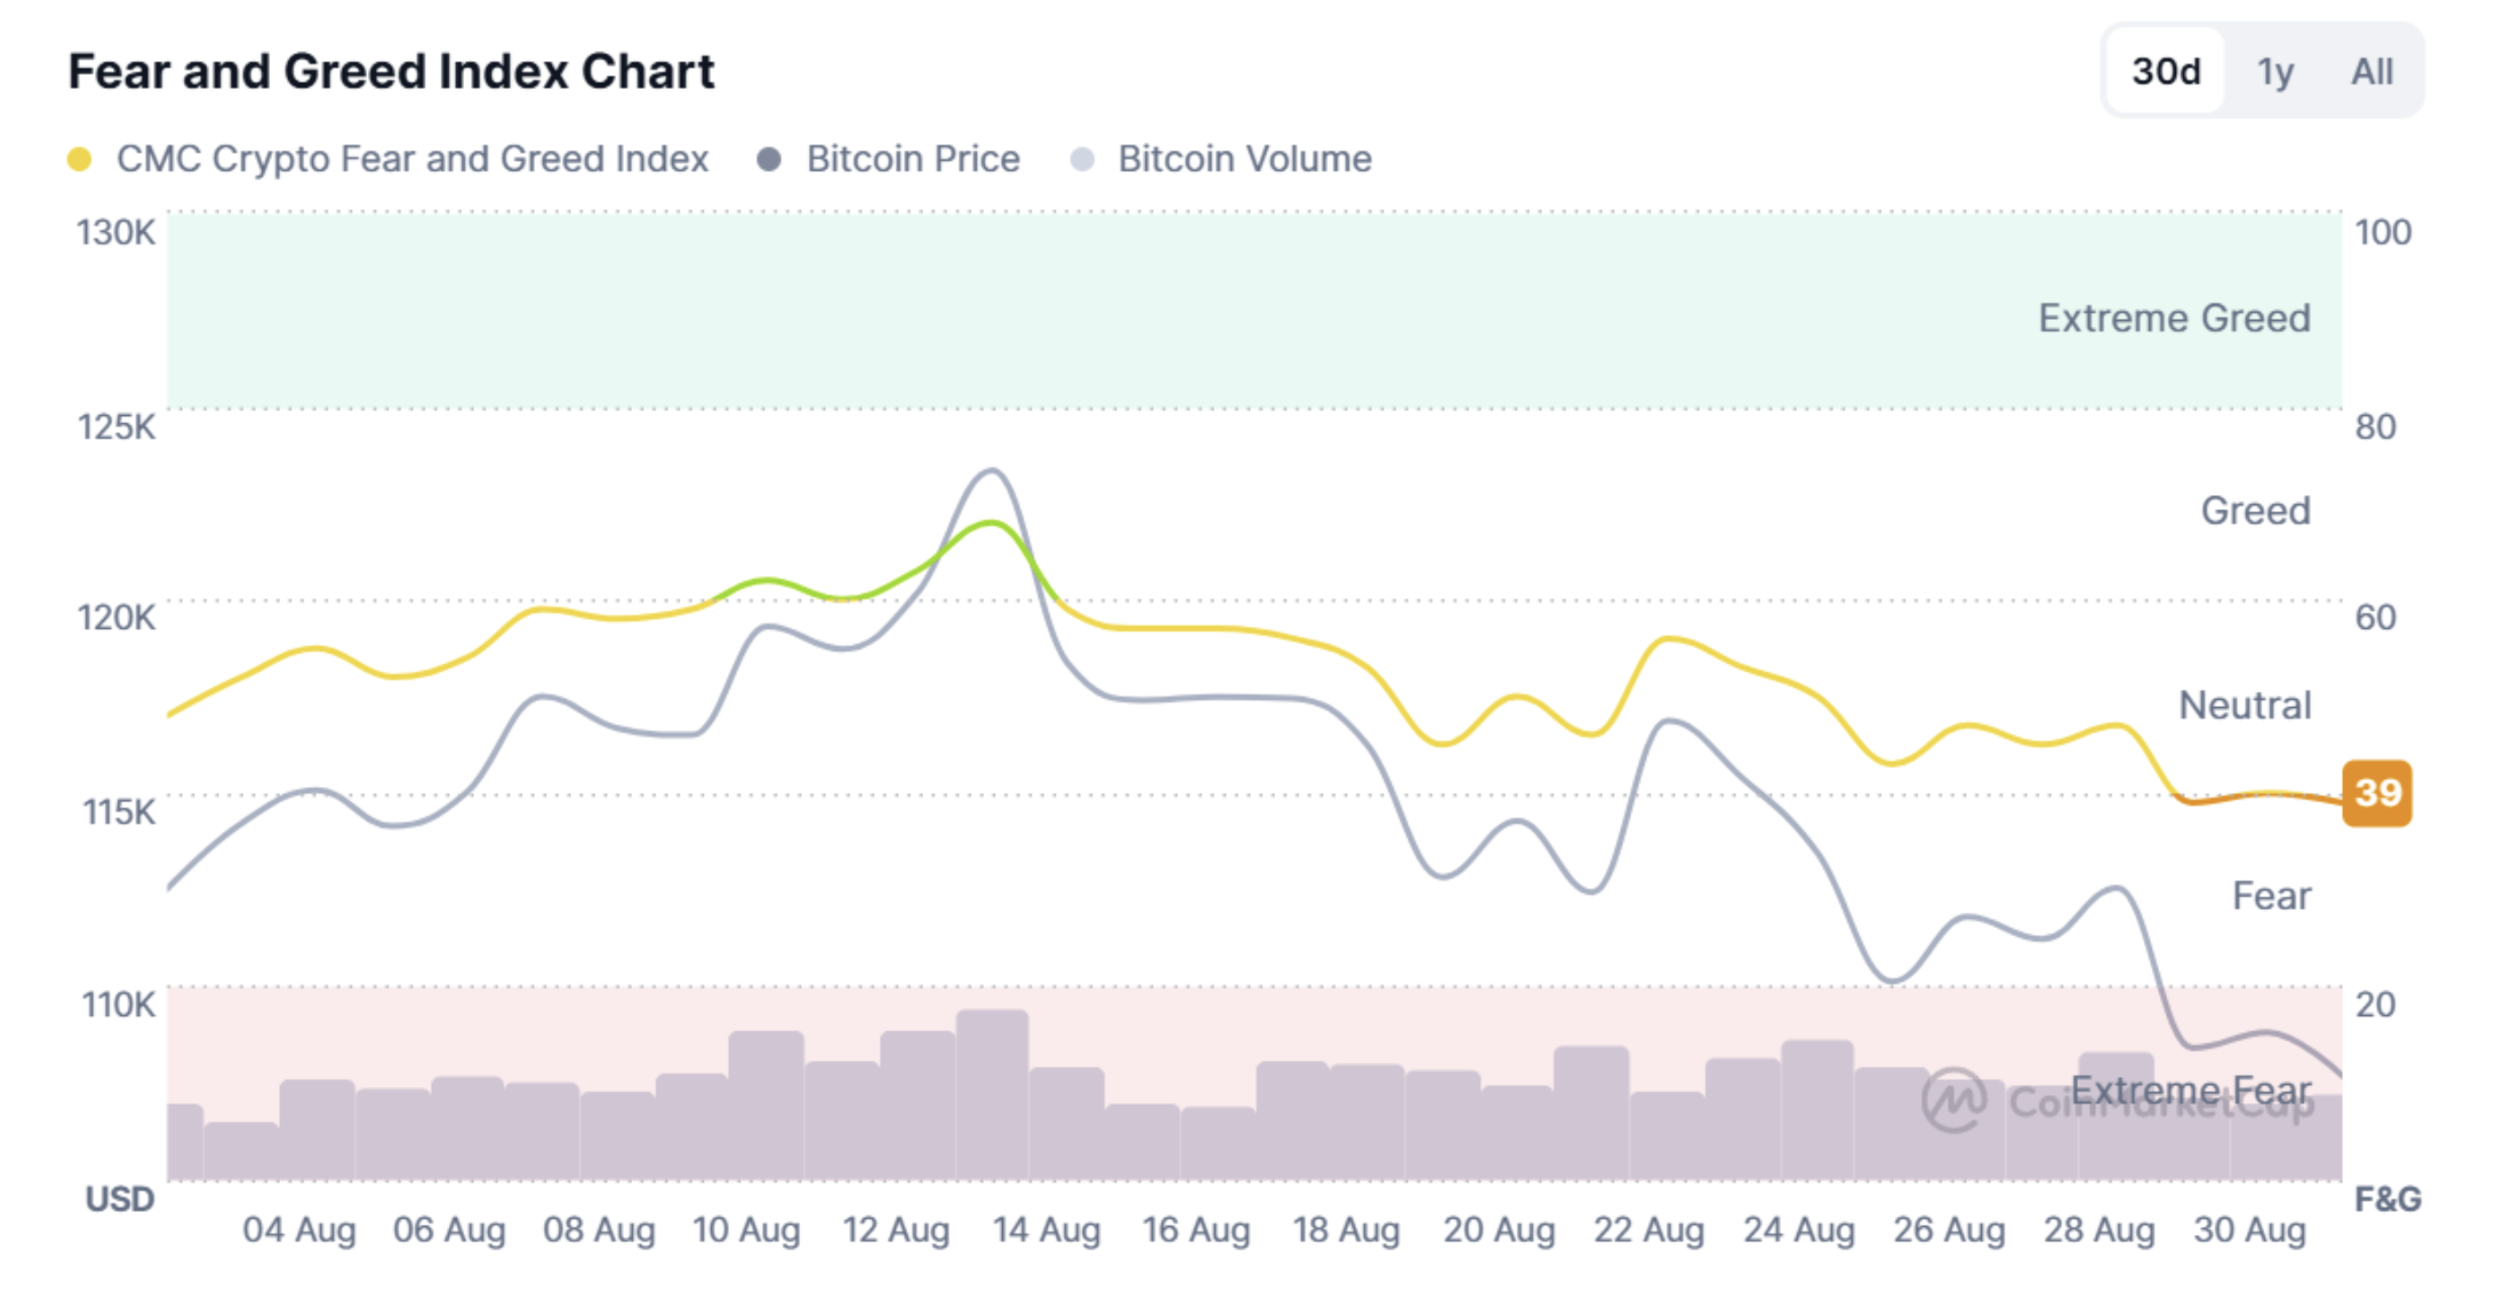
Fear & Greed Index. Source: CoinMarketCap
What to Expect in September
The key event in September will be the FOMC meeting on the 17th. For nearly a year, the Fed has held rates steady at 4.50%, despite pressure from President Donald Trump and the business sector pushing for cuts. At the end of August, Jerome Powell signaled the possibility of policy easing, which triggered a short-term rally in both Bitcoin and equities. As of September 1, 84.6% of market participants expect a rate cut.
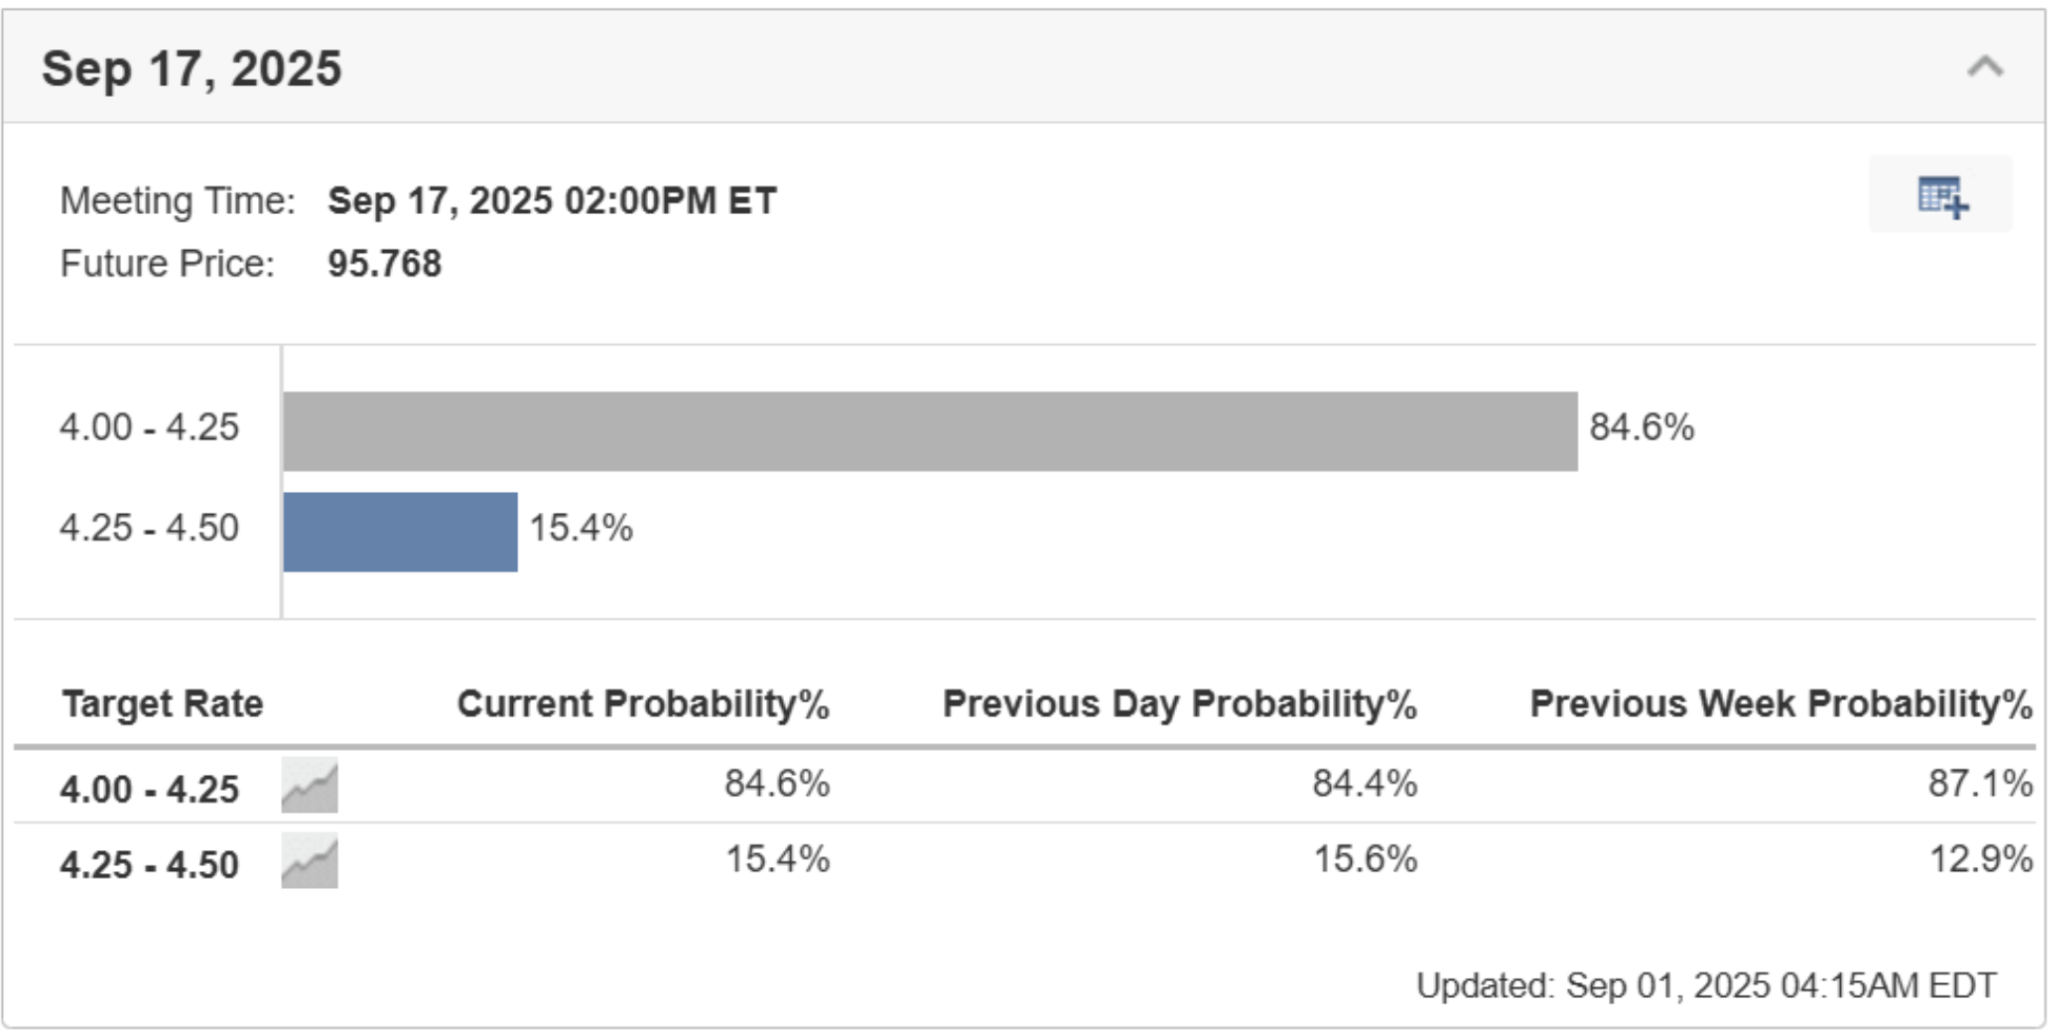
Source: Fed Rate Monitor Tool – Investing.com
A rate cut and confirmation of a dovish stance could be a powerful risk-on trigger, benefiting crypto alongside equities. What matters is not only the decision itself but also the forward guidance from the Fed. If the market receives a signal of an easing cycle, we could see an acceleration of ETF inflows, renewed appetite for altcoins, and a pickup in DeFi activity.
Conversely, keeping rates unchanged or issuing overly cautious commentary could lead to short-term profit-taking and corrections across risk assets. At current BTC and ETH levels, the market is particularly sensitive to Fed rhetoric – and any hint of delayed easing may trigger sell-offs.
Conclusion
August was a month of contrasts. Both Bitcoin and Ethereum set new all-time highs, but closed the month very differently: BTC ended down 6.49%, while ETH surged 18.75%, cementing its role as the primary beneficiary of institutional inflows. This reflects the transitional phase of capital rotation and shows that the market is no longer moving solely in Bitcoin’s shadow.
The market is awakening at all levels, as evidenced by rising volumes on both CEX and DEX. Yet sentiment remains surprisingly restrained – even fresh ATHs in the leading assets failed to spark euphoria. This makes the cycle structurally stronger, as the rally is fueled by liquidity and institutional flows rather than retail emotion.
A key variable is the continued expansion of dollar liquidity through stablecoin issuance, which strengthens the foundation for future growth. Ethereum has secured its status as an institutional-grade asset via ETF inflows, while Google Trends and top gainers point to an awakening of interest in riskier market segments. These are the early signs of an approaching risk-on phase.
Much in the coming weeks will depend on the Fed. Policy easing could align with these internal shifts and launch a new bullish impulse. If the rhetoric is hawkish, the market may pause instead. Either way, fall 2025 is shaping up to be a pivotal moment in the cycle – the balance between institutional maturity and altcoin revival could make it one of the most exciting and defining periods in crypto market history.
SimpleSwap reminds you that this article is provided for informational purposes only and does not provide investment advice. All purchases and cryptocurrency investments are your own responsibility.