What is a Market Cap in Crypto? The Only Guide You’ll Ever Need

This blog post will cover:
- Market Cap 101: Definition, Formula, and What It Does/Doesn’t Tell You
- Supply Mechanics: Circulating vs. Total vs. Max (and Burns)
- FDV, Float & Token Unlocks - The Dilution Lens
- Dominance & Market Segmentation (Context Matters)
- Beyond Market Cap - Complementary Metrics That Matter
- Red Flags & Pitfalls (Protect Your Downside)
- Conclusion
- FAQs
Cryptocurrencies explode. Fortunes are won, and vanish, in the blink of an eye. Understanding the true size and scope of these volatile, emerging assets is key to managing risk and spotting opportunity. Market capitalization – or "market cap" – is almost always the first metric quoted. But how much can you really infer from this potentially deceptive number?
This SimpleSwap guide strips away the complexities and reveals what is a crypto market cap, what it hides, and how to use it as a starting point. Discover supply secrets, unlock schedules, and chain data. Use simple "stress tests" to protect yourself. Learn to contextualize market cap with a practical checklist from SimpleSwap.
Why market cap is the starting point, not the finish line?
For those wondering “What is a crypto market cap?” - this is often the first number you see when evaluating a cryptoasset. It ranks digital currencies by size, providing an initial sense of their potential scale. However, relying solely on market cap can be misleading. Savvy investors realize that a high market capitalization doesn't automatically equal a solid investment. Ignoring factors like circulating supply, fully diluted valuation (FDV), and token unlock schedules can lead to unpleasant surprises.
This SimpleSwap guide cuts through the noise, providing you with the tools to correctly interpret market cap and understand what details to examine next. We’ll provide a handy formula, a 60-second example, and a pragmatic checklist. Note: This guide is for educational purposes, not financial advice.
The 20-second formula & example
The formula for how to calculate market cap crypto is straightforward:
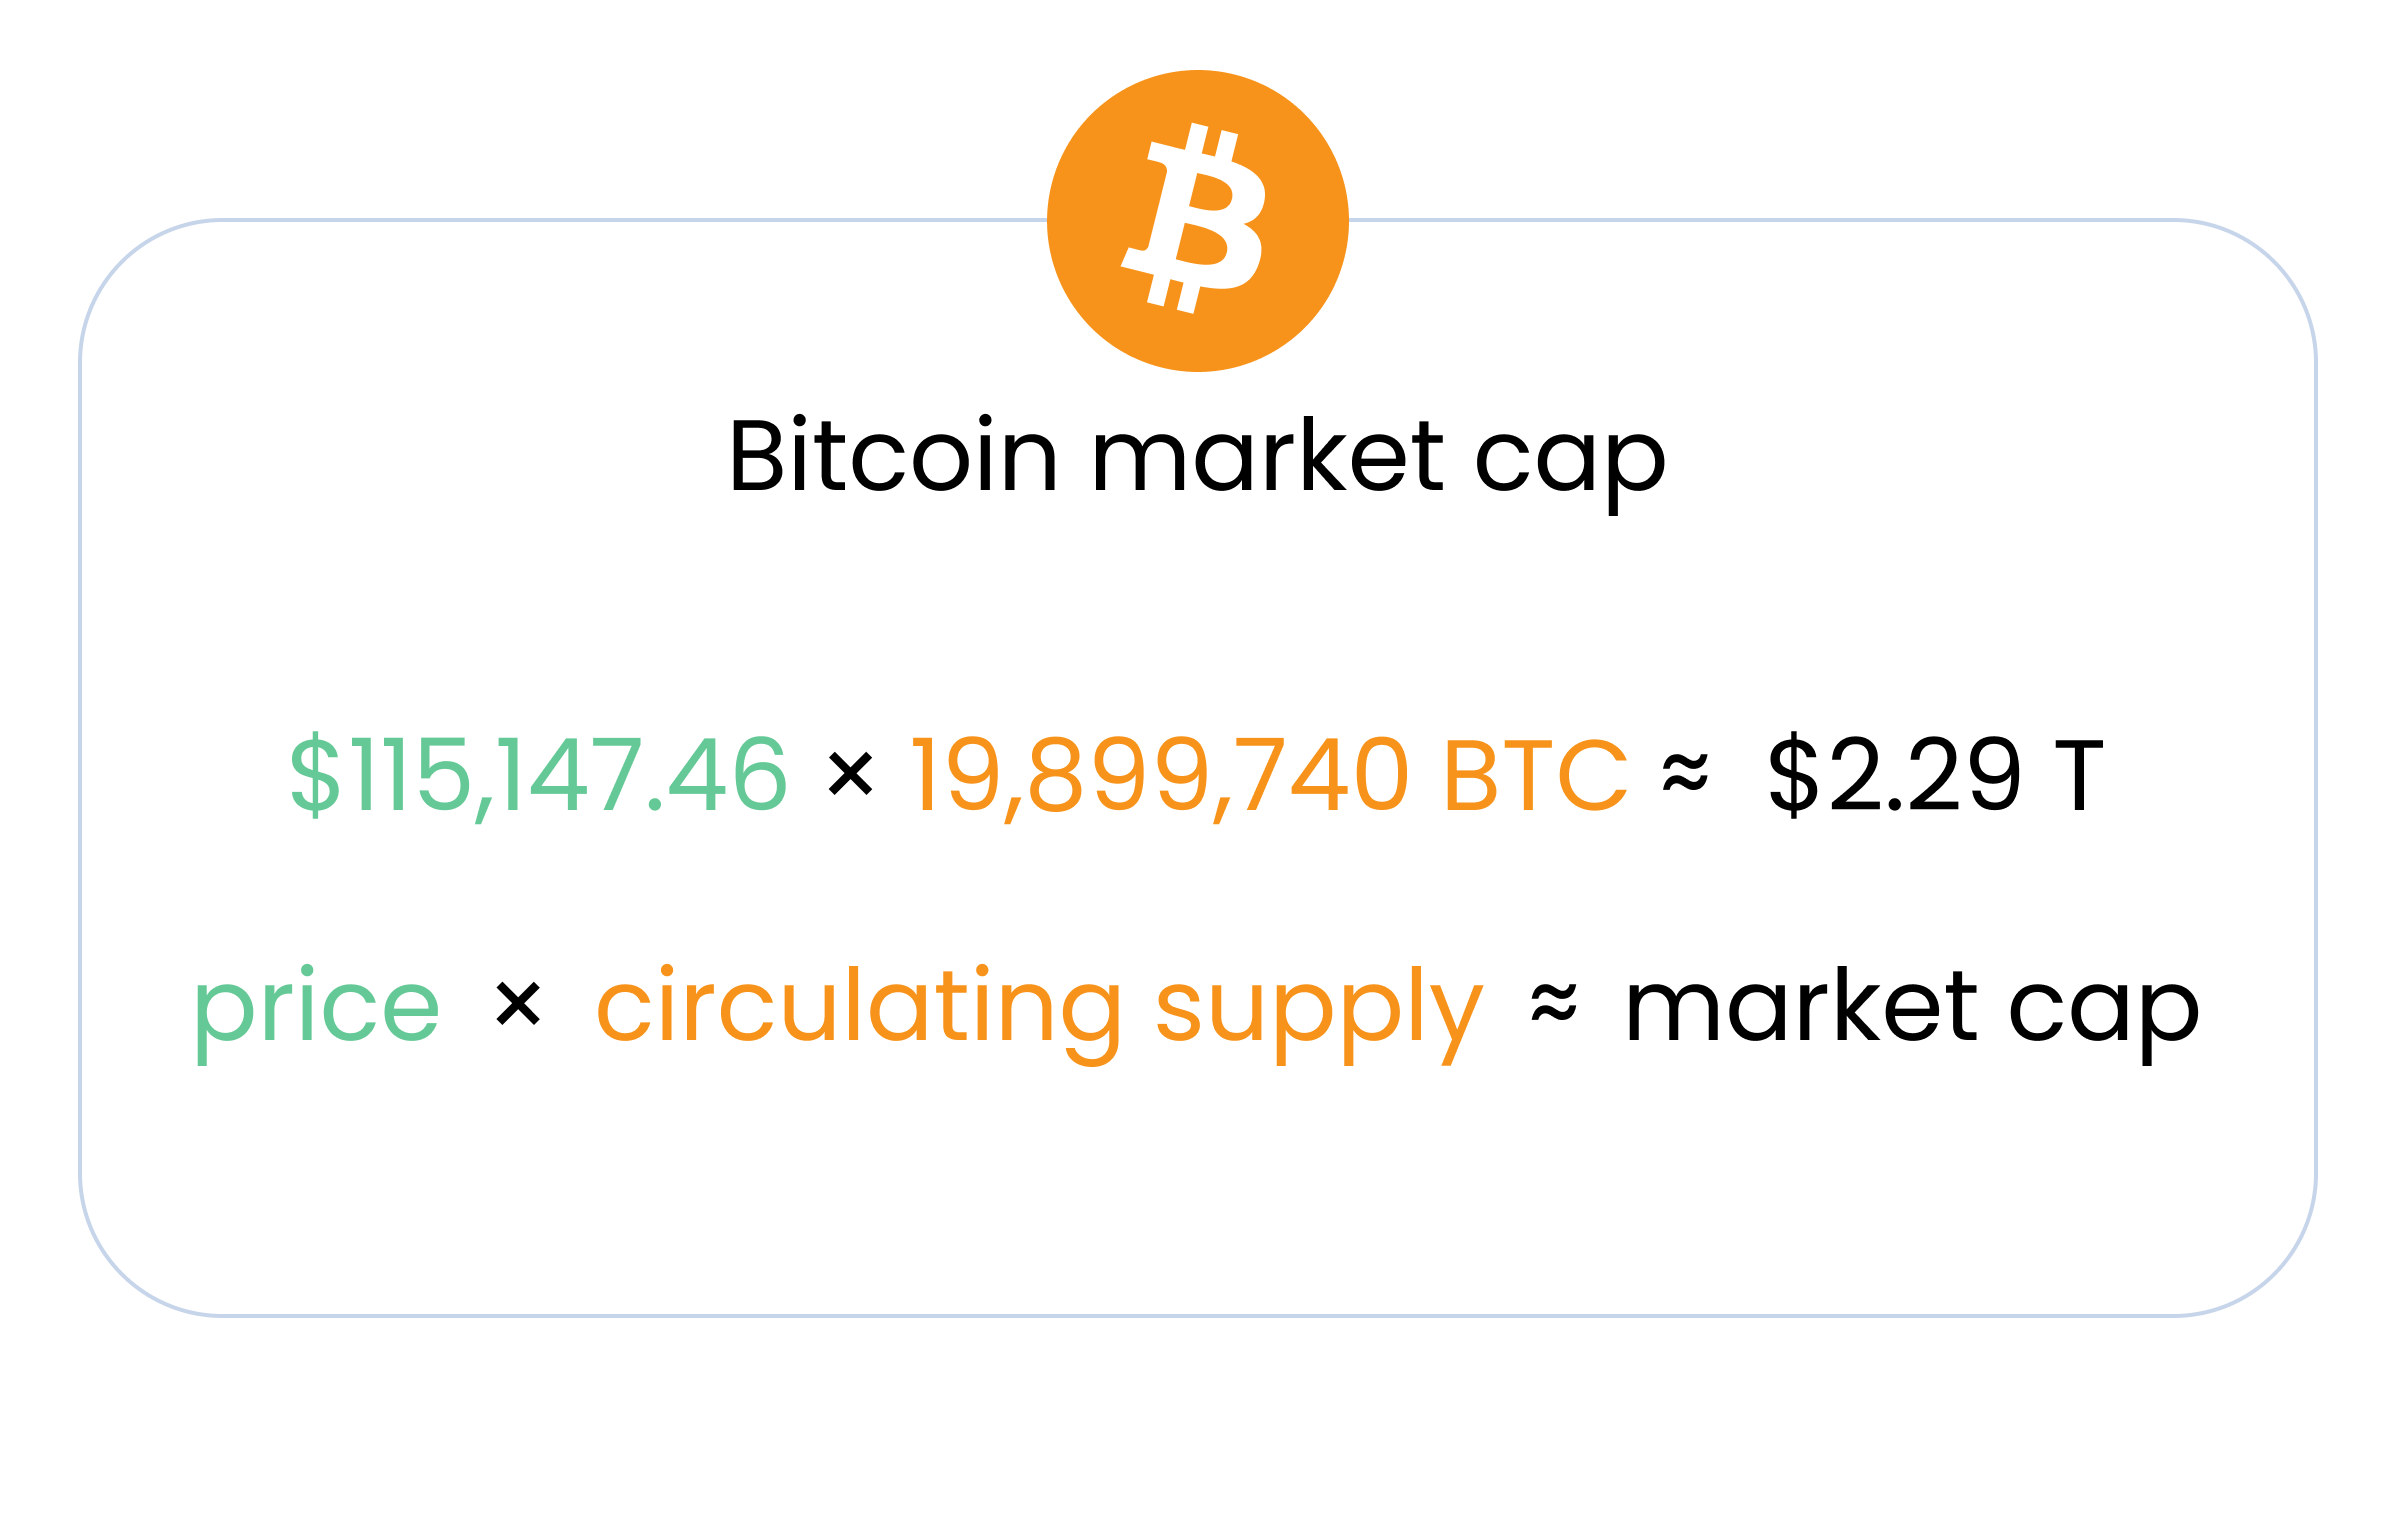
Market Capitalization = Price × Circulating Supply.
Reputable crypto trackers like CoinMarketCap and CoinGecko use the circulating supply – representing the number of tokens readily available for trading – not the total supply.
As of writing, the Bitcoin current market price is $115,147.46, its current circulating supply is 19,899,740 BTC, so its market cap is $2,291,404,515,660 (approximately $2.29 trillion).
Market Cap 101: Definition, Formula, and What It Does/Doesn’t Tell You
Crypto market capitalization represents the total value of a cryptocurrency's circulating supply. It is essentially a snapshot of the hypothetical cost needed to purchase all currently available coins or tokens at their current market price. In effect Market cap serves as a standardized metric, enabling comparison and ranking of different cryptoassets based on their relative size. It is a snapshot of aggregate value, not the total capital invested in a digital coin.
What market cap can tell you (and cannot)
Market cap provides valuable insights when used correctly. It can reveal the size and relative dominance of a cryptoasset within the market. A larger market cap crypto meaning a more established project. It also highlights growth trends over time if viewed historically; it certainly isn’t foolproof.
A high market cap might seem like a good sign, but it doesn’t always mean much on its own. You can still run into problems with liquidity - like, there just might not be enough people actually trading it. So if you try to buy or sell a big chunk, you might end up moving the price more than you’d like. Also, just because something’s a large cap doesn’t mean it’s safe.
These projects can still swing wildly or drop fast when the market shifts. Big numbers don’t always equal stability. Small floats can often be prone to manipulation, and the resultant price spikes/crashes misrepresent real project viability. For example, headlines highlighting the "total crypto market cap" can be misconstrued, so should only be treated as a very broad indicator.
Supply Mechanics: Circulating vs. Total vs. Max (and Burns)
Circulating supply represents the best estimate of the number of crypto tokens available and actively circulating within the public market. It intentionally excludes tokens that are locked, reserved, allocated to the team and foundation (not yet released), or otherwise not accessible to the general public. Major crypto tracking websites utilize the circulating supply figure when calculating market cap, granting a truer reading of an asset's relative value.
This concept mirrors the "public float" in traditional stock markets, providing analysts a better gauge on tradable equities, rather than the total issued stock.
Total & max supply (and burns)
Total supply refers to the number of tokens that currently exist, not counting those that have been permanently burned. Burning means removing coins from circulation for good - usually to reduce the supply and possibly make the rest more scarce. Max supply, if there is one, sets the absolute limit on how many tokens will ever be created.
Some projects have a fixed cap, others don’t. Together, these numbers give you a rough idea of how scarce a coin might become over time, especially if burns happen regularly. However, burns do not always immediately impact circulating supply.
Consider a token with a maximum supply of 1 billion, a total supply of 800 million, and a circulating supply of 600 million. Burning 100 million from the total supply reduces the total to 700 million, but the circulating supply remains at 600 million if the burned tokens were previously held in reserve.
Conversely, a project may allocate 10 million tokens to a burn wallet at genesis, and thus, never include those tokens in the current calculation of circulating or total supply.
FDV, Float & Token Unlocks - The Dilution Lens
Fully Diluted Valuation (FDV) offers a more comprehensive perspective than market cap alone. FDV is calculated as the current Price multiplied by the Maximum (or Total) Supply, assuming all tokens are in circulation. A high FDV relative to the current market cap, particularly when coupled with a low circulating supply, can indicate potential future sell-side pressure as locked tokens become unlocked and enter the market - potentially diluting the value of existing holdings.
Consider a project where only 10% of its token supply is currently circulating, with the remaining 90% locked in vesting contracts. While the current market cap might appear modest, the FDV paints a different picture, implying a substantial potential increase in supply and greater risk.
How to read vesting and unlock schedules
Vesting and unlock schedules detail the planned release of previously locked tokens. Unlock schedules can follow a "cliff" structure, where a large batch of tokens is released at a specific date, or a linear schedule, where tokens are gradually released over time. The size and timing of these unlocks relative to the current circulating supply are critical considerations. Resources such as DefiLlama Unlocks, TokenUnlocks, and Messari offer calendars to track these events.
Here is a 3-step checklist to assess the impact of token unlocks:
What percentage of the total supply is scheduled for release in the next 30-90 days?
Who are the recipients of these unlocked tokens (team, investors, treasury)?
How does the unlocked amount compare to the average daily trading volume?
Low-float/high-FDV risk in practice
Here’s the thing - when a project launches with only a tiny bit of its tokens in circulation (low float) but somehow already has a sky-high valuation, it usually doesn’t go well in the long run. The hype might carry it for a bit after the TGE, but once early investors or team members start unlocking their tokens, there’s often a lot of selling. And that can really hit the price hard.
So before jumping into anything, it’s worth taking some time to play out what happens as more tokens hit the market. Look at the vesting schedule, try to picture how the supply will grow over time. It’s not the most exciting part of research, but it can save you from getting blindsided later when the token starts dumping and you’re wondering why.
Dominance & Market Segmentation (Context Matters)
So, Bitcoin dominance - it’s just a way to see how much of the total crypto market is made up of Bitcoin. Same idea for Ethereum dominance. These numbers aren’t just stats; they actually help show what phase the market might be in.
Like, when Bitcoin dominance is high, it usually means people are playing it safe, sticking with the “blue chip.” But when that number starts to drop, especially fast, it often means traders are moving into altcoins - chasing risk, basically. That shift can kick off what people call an altcoin season. It’s not a perfect system, but looking at dominance gives you some context for what kind of market we’re in and where the money might be going.
It is advised to view dominance as background context rather than a trading signal. The metric reveals trends over time, not guaranteed future performance.
Beyond Market Cap - Complementary Metrics That Matter
Here are a few more metrics one should pay attention to.
TVL (for DeFi tokens)
Total Value Locked (TVL) represents the total dollar value of all assets deposited within a decentralized finance (DeFi) protocol. Comparing TVL to market cap can offer insights into whether a DeFi token seems under- or overvalued relative to the assets it manages. However, it's crucial to be aware of potential double-counting of assets across different protocols and evolving standards for TVL calculation. Referencing DefiLlama's methodologies helps understand verifiability.
Caution: TVL ≠ Token Value - A high TVL doesn't guarantee a strong token price. As an example, if a protocol has a $100M TVL and its token has a market cap of $20M, it could be considered undervalued.
Volume & liquidity (why they’re different from size)
Market cap does not directly translate to tradable liquidity in a market. Projects with large market caps might exhibit thin order books, making it difficult to execute sizable trades without significant price slippage. Price manipulation, especially wash trading (where the same user buys and sells to inflate volume), can artificially inflate trading volume metrics.
One should cross-check trading volumes across different exchanges and look for consistent volume across various venues.
Realized cap, NVT, MVRV (on-chain context)
Realized capitalization values each coin or token at the price it last moved on-chain. This provides a useful measure of "economic weight" within the network and can offer unique context regarding the current financial cycle.
Network Value to Transactions Ratio (NVT) is akin to a P/E ratio in traditional finance, comparing market cap to the volume of transactions occurring on the blockchain. MVRV (Market Value to Realized Value) compares the market capitalization to the realized capitalization, offering insights into potential overbought or oversold conditions.
Red Flags & Pitfalls (Protect Your Downside)
Be mindful of the potential for misreported data, inaccurate unlock schedules, and wash trading that can artificially inflate price and volume, leading to distorted market cap figures. Always cross-verify information across multiple reputable sources. Verify Before You Trust:
Confirm data from two different data providers. Check unlock schedules on project resources and data aggregators. Scan a blockchain explorer.
Aggregated 'total crypto market cap' is often cited. However, it needs understanding. Methodologies vary across different sources and exchanges. Some trades are in stablecoins, not cash, to accurately reflect total cash inflows. Therefore total market value should be understood as general context, not a definitive assessment of overall performance.
Conclusion
Now that we have learned what does market cap mean in crypto, we can say that it remains a crucial starting point when evaluating cryptoassets. However, it's far more effective when combined with a solid grasp of supply dynamics (circulating, total, max), a keen awareness of FDV and unlock schedules, and a consideration of complementary metrics like TVL and on-chain analytics. By applying this knowledge, one should significantly improve their assessment potential. Before making any trading decisions, we encourage you to apply the quick checklist in this text to help minimize risk potential.
To continue your learning journey, explore SimpleSwap's other educational articles on cryptocurrency investing. You may find that additional reading aids in your future success.
FAQs
Below are a few of the most commonly asked questions.
Is the market cap calculated with circulating or total supply?
Circulating supply on major trackers.
Is FDV a price prediction?
No; it’s a hypothetical valuation assuming full circulation.
What’s the difference between TVL and market cap?
TVL measures assets locked in DeFi protocols; market cap measures current valuation of all circulating tokens.
Where can I see unlock schedules?
DefiLlama Unlocks, Tokenomist/TokenUnlocks, Messari.
How do on-chain metrics help?
Realized cap/NVT/MVRV add economic context that market cap alone lacks.