Market Overview: June 2025

This blog post will cover:
- The 12-Day War
- Local DeFi Crisis: The ZKJ Liquidity Attack
- FOMC Meeting – No Surprises
- Bitcoin Performance in June
- Ethereum Performance in June
- BTC Dominance & ETH/BTC Pair
- Trading Activity & Volume
- Top Gainers & Losers
- Google Trends Analysis
- Market Sentiment in June
- Risks & What Could Go Wrong
- Conclusion
Summer is traditionally a challenging season for financial markets — vacation season reduces liquidity and dampens participant activity. There's a reason the old saying "Sell in May and go away" still circulates in financial circles. The first month of summer is often viewed as a continuation of May’s trends, and in 2025, this was especially true — May proved to be a turning point for the crypto market.
After months of stagnation and disappointment, the market not only came alive in May but also sent a clear signal of a renewed bullish narrative. Bitcoin reached a new all-time high, while Ethereum posted a strong rebound, helping to restore investor confidence.
As a result, June began with optimism and expectations of continued growth. However, instead of steady gains, the markets faced significant challenges. A 12-day war in the Middle East, rising geopolitical tensions, and uncertainty surrounding the Federal Reserve's policy created a wave of fear. Volatility spiked, but the crypto market ultimately held its ground. June confirmed that May’s uptrend wasn’t a fluke — although sustained growth still requires time.
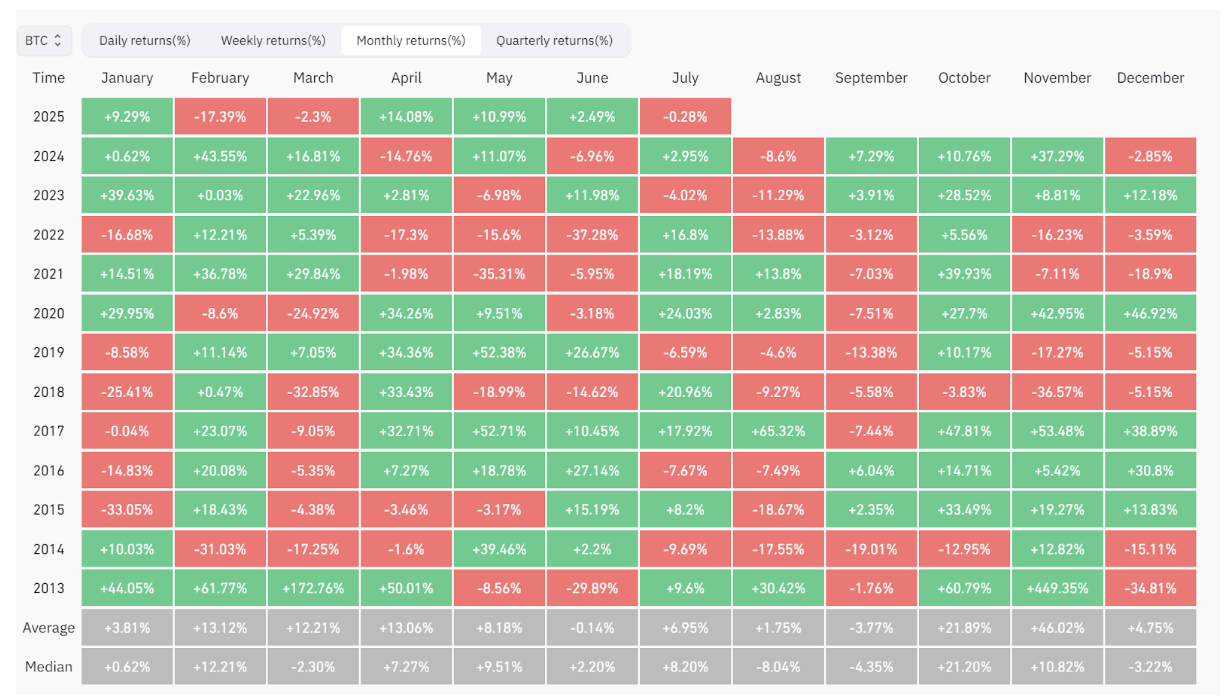
Historical BTC Performance | CoinGlass
In this review, we’ll break down the key events of June:
The Federal Reserve meeting and its impact on investor sentiment
The Middle East conflict and its consequences for crypto
Signals pointing toward continued market growth
We’ll also examine the performance of Bitcoin and altcoins, trading activity, and participant sentiment. Finally, we’ll try to answer the key question: What can we expect from July and Q3?
The 12-Day War
One of the biggest tests for the market in June was the 12-day war between Israel and Iran, which put the crypto sector’s resilience to the test. On the night of June 13 (Friday to Saturday), Israel launched strikes on Iran’s nuclear facilities, sending Bitcoin plummeting below $103,000. Iran responded with immediate counterattacks. Despite these extreme geopolitical risks, Bitcoin rebounded quickly, regaining the $107,000 level by Monday — a clear sign of trend strength.
On the following weekend (June 21–22), the U.S. Air Force launched strikes against additional Iranian nuclear targets. While traditional markets were closed for the weekend, crypto kept trading — highlighting its unique nature. Bitcoin dropped below $100K (a 5% decline), and Ethereum lost over 8%. The community braced for a major crash and a potential “Black Monday,” but instead, the market swiftly recovered. Bitcoin bounced back to $102,000, and altcoins regained lost ground.
On Thursday morning at 7:00 AM local time, the 12-day war officially ended with a 12-hour ceasefire agreement. Following the news, Bitcoin climbed back to $106,000, while some altcoins surged over 15% in a single day.
As with the first wave of attacks, the crypto market experienced a sharp drop but was quickly bought up — a hallmark of a still-intact bull market. In a bear market, such geopolitical events typically trigger prolonged declines. Fast recoveries after shocks are a key indicator of a sustainable uptrend.
The market endured a major stress test — and didn’t panic. As the conflict de-escalates and trust continues to build, crypto, as a highly sensitive indicator of global capital flows, may be poised for the next leg up.
Local DeFi Crisis: The ZKJ Liquidity Attack
While the world's attention was on geopolitical risks, a localized crisis unfolded in the DeFi space.
On June 15, the ZKJ token from Polyhedra Network lost over 87% of its value due to a coordinated liquidity attack and cascading liquidations. The key triggers included large LP position withdrawals, token dumps on decentralized exchanges, and vulnerabilities in PancakeSwap V3 liquidity pools. Details of the attack are available on our social channels: X, Telegram, Discord, Facebook.
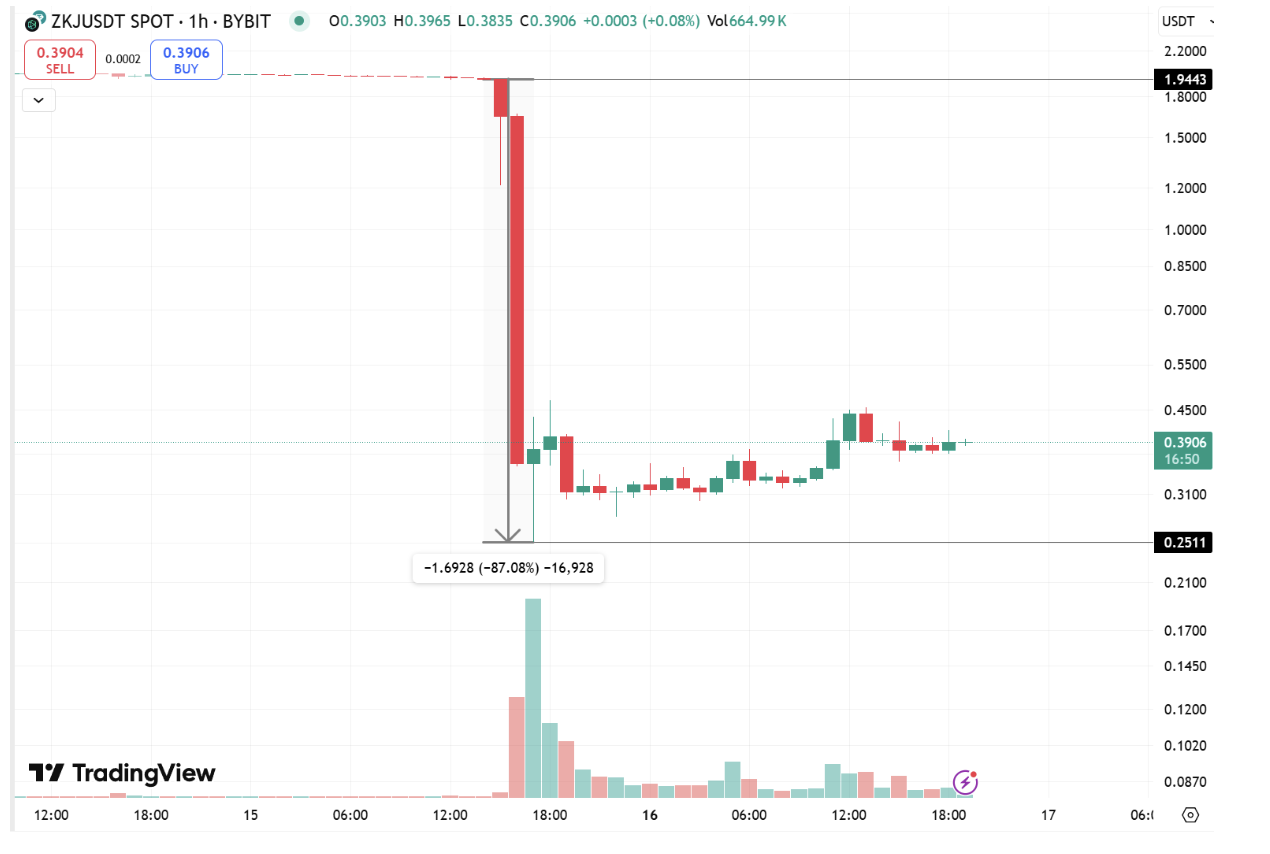
ZKJ/USDT. Source: TradingView
In May, anomalous ZKJ volume on PancakeSwap with zero volatility raised eyebrows. After Binance Alpha program terms changed, the ZKJ/KOGE pool was left unprotected. Targeted sales, synchronized activity by large wallets, and token transfers to exchanges set off a chain of liquidations and liquidity drain.
Key takeaways from the ZKJ incident:
High trading volume ≠ market stability
Any low-liquidity pool is a potential target for cascading liquidations
Whether this was a deliberate attack remains unclear. However, such scenarios occur far too often to be dismissed. It’s not about conspiracy theories — it's about fundamental risk management.
FOMC Meeting – No Surprises
The key macro event of June was the Federal Reserve’s meeting on the 18th. As widely expected, the interest rate remained unchanged at 4.50%. The market took the news in stride, with little to no change in volatility.
During the press conference, Jerome Powell emphasized that the current labor market data does not justify a rate cut. However, he didn’t rule out the possibility that such a move could become appropriate over time. Powell also noted that rising tariffs pose risks to economic activity and could trigger a new wave of inflation. Under these conditions, the Fed has good reason to wait before making any policy adjustments.
Overall, the Fed’s stance remained cautious. The central bank prefers to wait for more labor market data and the impact of tariffs before making any changes to its policy. A stable interest rate is a neutral factor for Bitcoin, but inflation driven by tariffs or geopolitical instability could enhance Bitcoin’s role as a hedge. That explains why BTC remained resilient amid global tensions — investors increasingly see it as a safe haven.
Bitcoin Performance in June
After setting a new all-time high in May, Bitcoin entered a consolidation phase in June. For most of the month, it traded in a range between $98,000 and $107,000, with the majority of price action staying above the $104,500 level. The monthly high was $110,530, the low hit $98,200, and the month closed around $107,100 — right in the middle of the range. Geopolitical tensions in the Middle East kept market participants on edge, but Bitcoin held firm.
Price behavior in June reflected a mixed picture. Demand remained strong, but someone was clearly absorbing that demand by taking profits and unloading positions. Consolidation amid large ETF inflows likely indicates an accumulation phase. Yes, sellers are taking profits, but their selling pressure is being absorbed by institutional demand — reinforcing the strength of the trend.
The upward trend remains intact for now. June’s price action resembled more of a sideways correction, potentially setting the stage for further growth. This view is further supported by ETF inflow data, which offers deeper insight into market sentiment and the potential direction of the next major move.
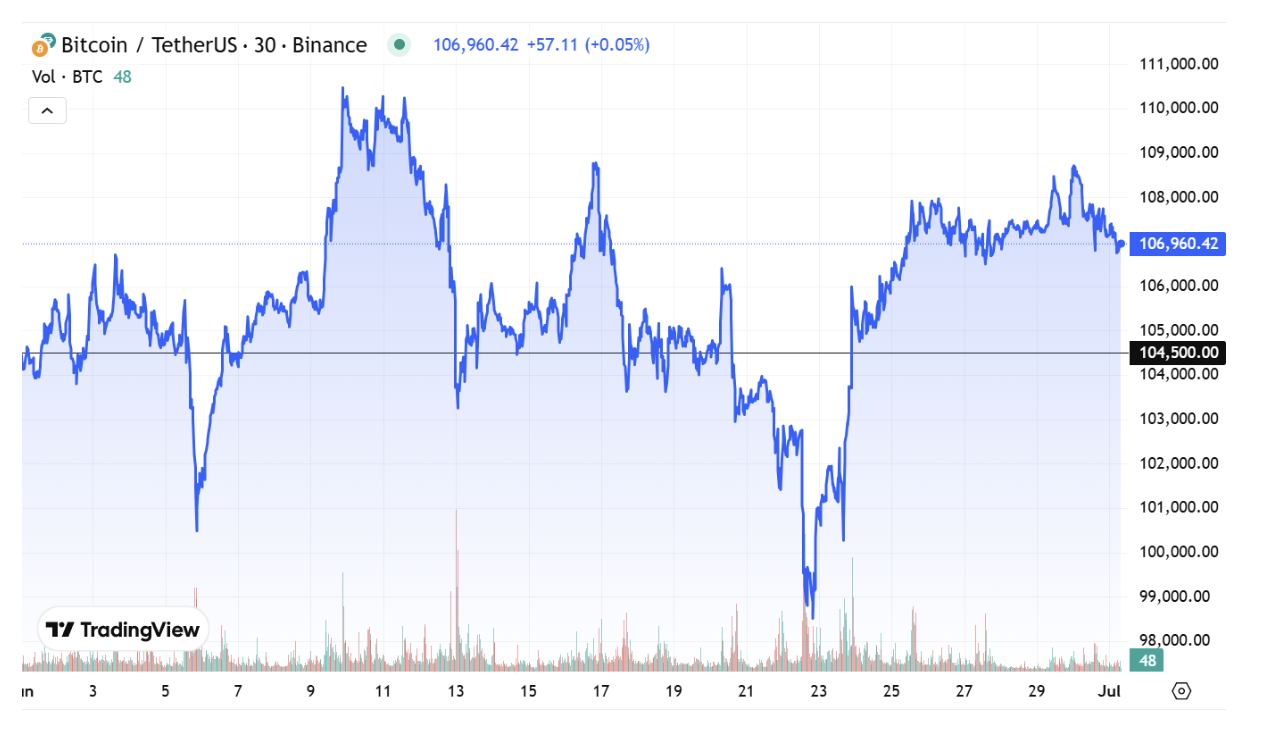
Bitcoin (BTC) Chart. Source: Cryptorank
Bitcoin ETF Inflows
One of the strongest indicators of sustained interest in Bitcoin was the record-setting inflows into spot ETFs. According to Wallet Pilot, net inflows in June reached $4.5 billion. BlackRock’s IBIT led the pack, consistently increasing its BTC holdings. Large-scale BTC purchases via ETFs during a sideways market reflect strong institutional demand — but also the presence of sellers who are temporarily capping further price growth.
This kind of accumulation lays the groundwork for a powerful breakout. If selling pressure diminishes, ETF inflows could serve as the catalyst for a renewed and stronger bullish impulse.
The ETF flows histogram for the past month clearly illustrates the consistent growth in demand — especially during spikes in geopolitical tension. It’s a visual snapshot of how institutional capital responded to June’s events and where demand was strongest.
These insights are especially important during a consolidation phase. They show the market is in a delicate balance between large buyers and sellers — a balance that could tip in either direction with continued inflows.
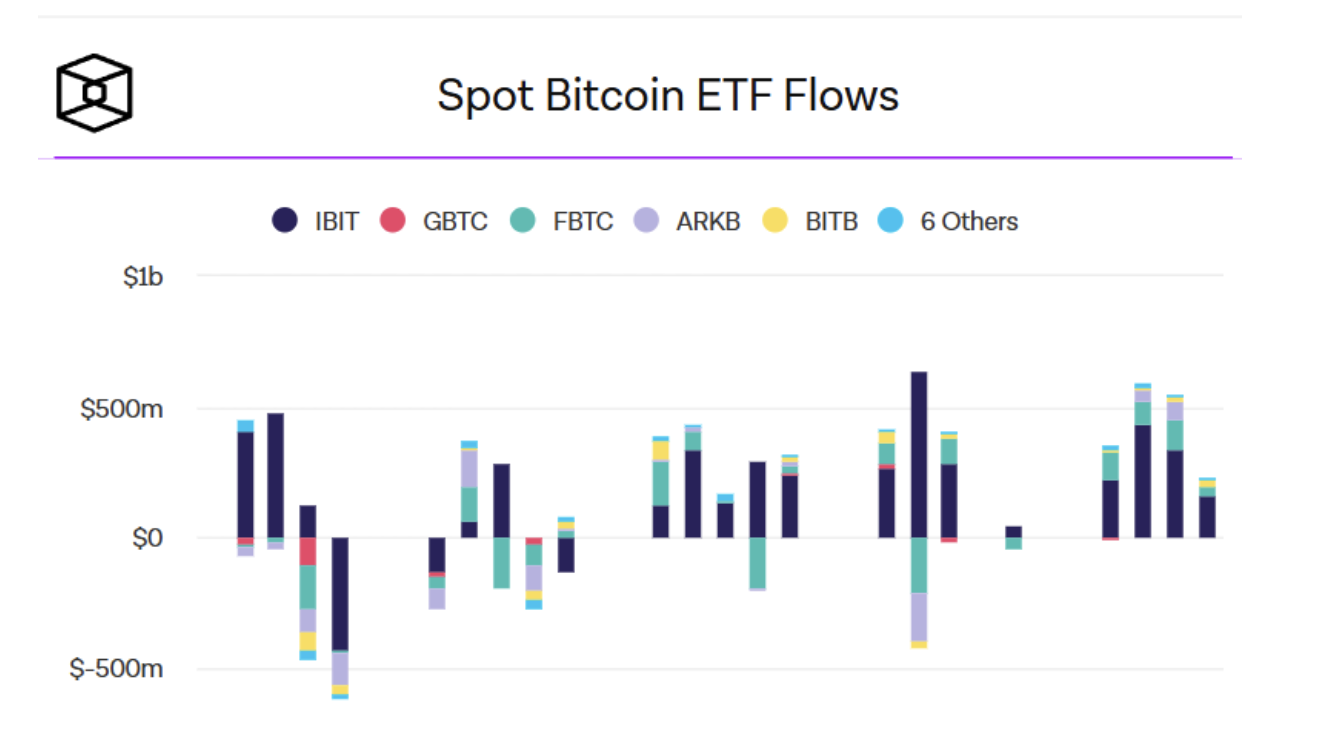
Spot Bitcoin ETF Flows. Source: The Block
Ethereum Performance in June
Ethereum also traded sideways in June, similar to Bitcoin, though within a wider price range. The top of the range was around $2,650, the bottom near $2,400, with periodic breakouts that swept liquidity from both directions. The monthly high reached $2,879, while the low dropped to $2,111, with the month closing at $2,480. This broader price swing reflects significantly higher volatility compared to Bitcoin and highlights ETH’s more speculative trading profile. Amid this volatility, institutional flows into ETH provide valuable context for assessing the long-term investor outlook.
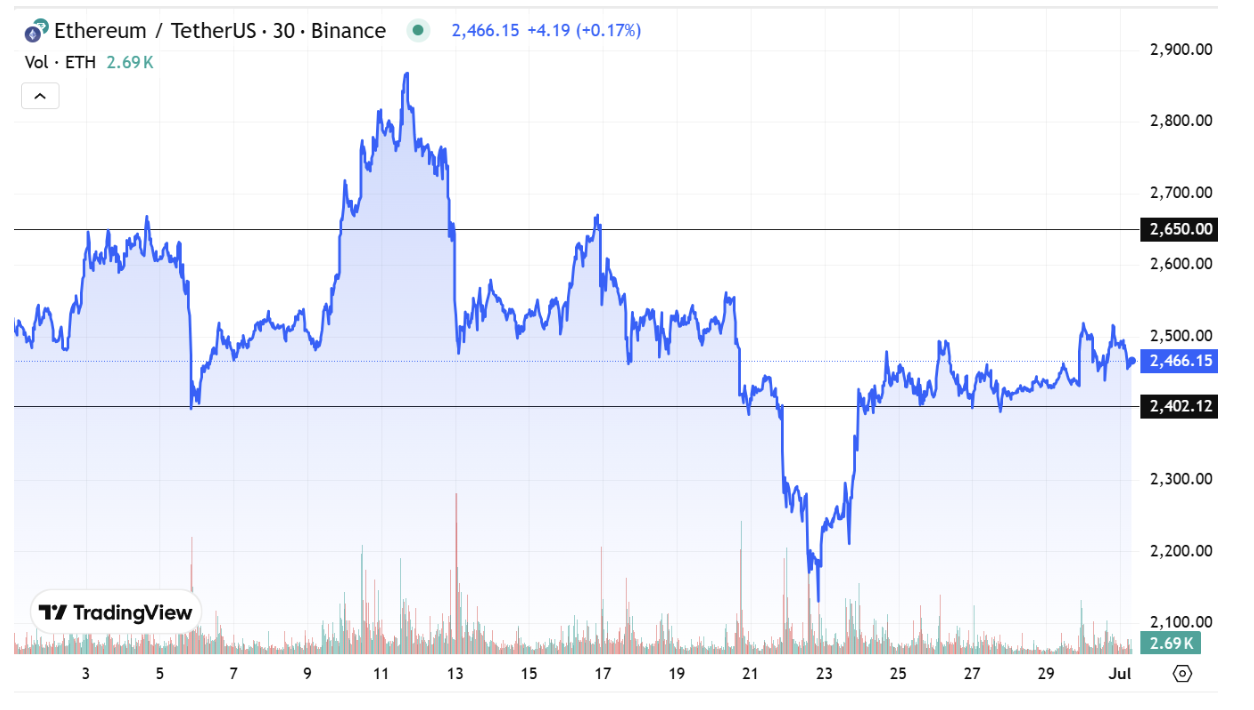
Ethereum (ETH) Chart. Source: Cryptorank
Ethereum ETF Inflows
Institutional interest in Ethereum remained strong throughout June. Spot ETH ETF inflows showed consistent growth, with the histogram clearly illustrating that inflows significantly outpaced outflows.
This steady accumulation confirms a renewed interest in the asset and underscores its potential. One of the key future growth catalysts could be the integration of staking into spot ETH ETFs — a feature BlackRock is actively promoting, and which we explored in detail in our May review. The ETF flow histogram for June provides a clear picture of this demand, showing how capital is slowly shifting in favor of ETH — even amid a challenging macro environment.
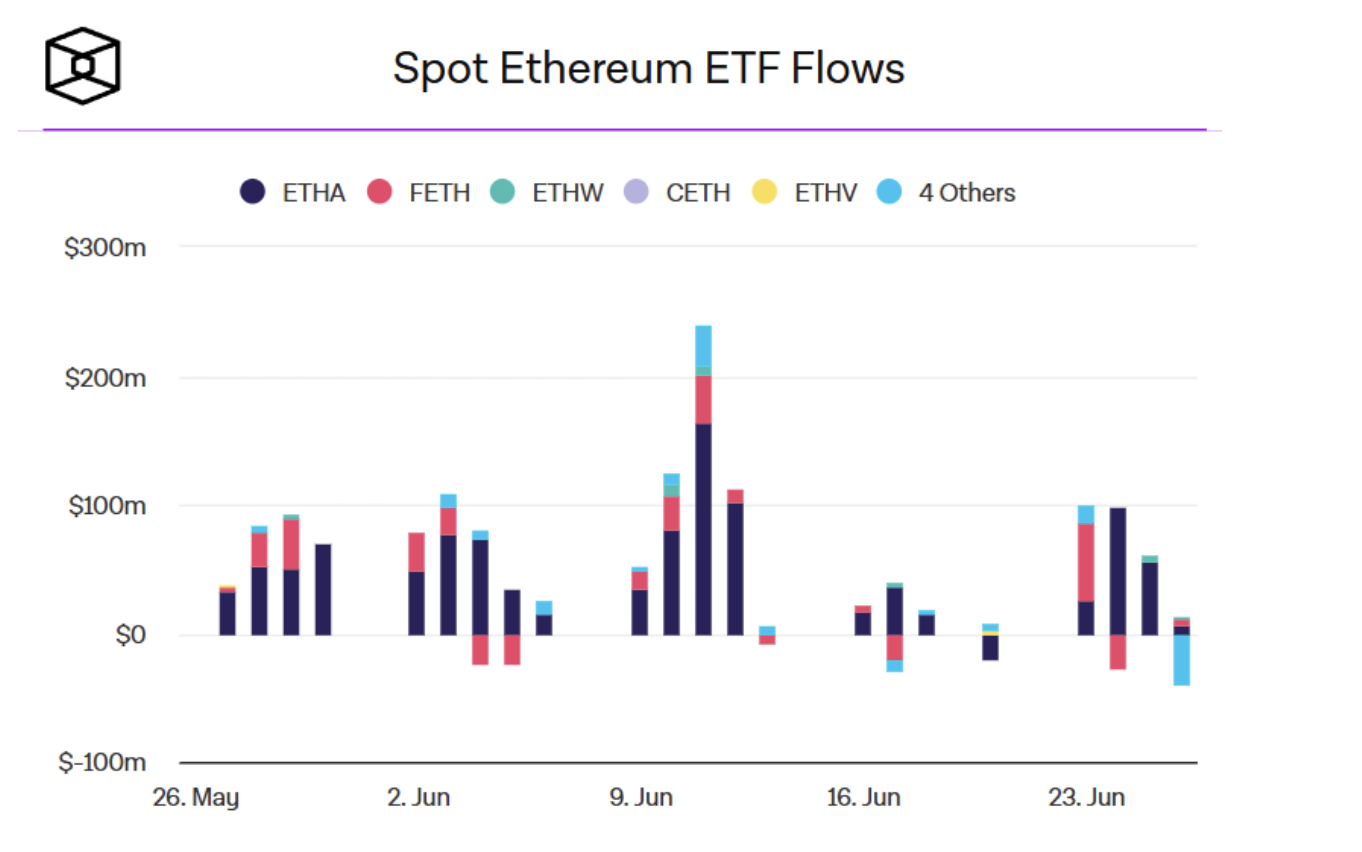
Spot Ethereum ETF Flows. Source: The Block
BTC Dominance & ETH/BTC Pair
In June, Bitcoin dominance (BTC.D) continued to hover near the key resistance zone of 64.8%–67.5%, reflecting Bitcoin’s clear advantage in the capital structure. Every dip in dominance was quickly bought up, signaling that altcoins are not yet ready to take the lead.
Dominance trends typically reveal how capital is being distributed across the market. Following a strong Bitcoin rally, investors often take profits and rotate into altcoins in search of higher returns. Currently, BTC.D is sitting within the potential reversal zone (64.8%–67.5%). If a pullback occurs and dominance declines toward the 48%–43% range, it could trigger a strong altcoin rally.
The ETH/BTC pair remained in correction throughout June, highlighting Ethereum’s relative weakness compared to Bitcoin. This suggests that conditions for capital rotation into altcoins haven’t fully materialized yet. It’s important to note that Ethereum experienced its sharpest drawdown in 2025, falling over 60% in just four months. This explains investors’ caution — they're still favoring BTC accumulation via ETFs (which saw $4.5 billion in inflows in June), while being hesitant to rotate into altcoins.
The reaction in May near a key ETH/BTC support level could be an early sign of a potential trend reversal. The coming 1–2 months will be critical in determining whether a broader altcoin rotation is beginning — or if it was just a temporary bounce. A potential breakdown scenario is illustrated in the chart below.
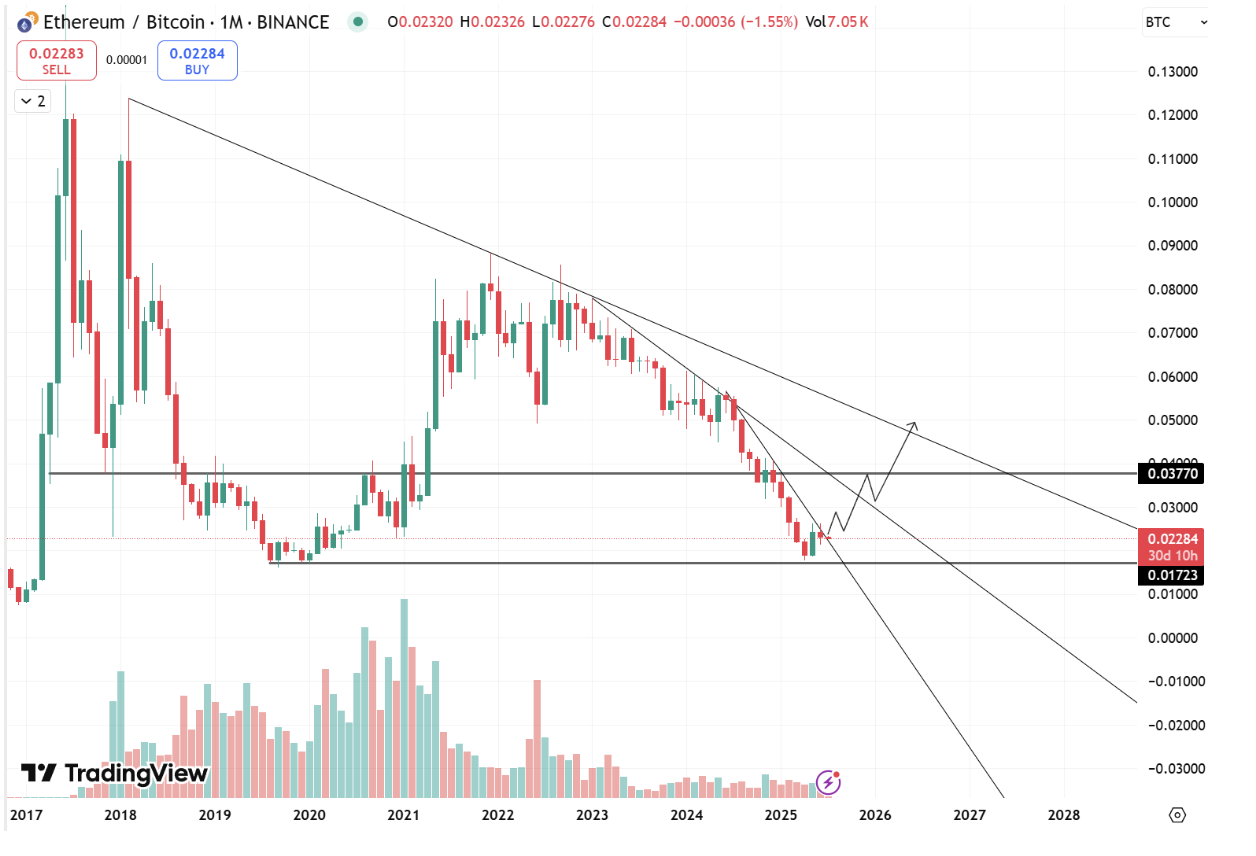
ETHBTC. Source: TradingView
Trading Activity & Volume
In June 2025, trading volume on centralized exchanges recorded the lowest monthly figure of the year, totaling approximately $1.04 trillion. The histogram below clearly shows the typical seasonal decline in summer activity — participants go on vacation, liquidity dries up, and funds and institutional players reduce operations.
Even with June’s geopolitical turmoil and significant inflows into spot Bitcoin ETFs, trading volumes didn’t pick up. This divergence highlights that institutional activity is currently focused less on speculative trades and more on strategic accumulation, which doesn’t always show up in daily volume metrics. It also explains why volatility remained relatively low despite a dense news cycle.
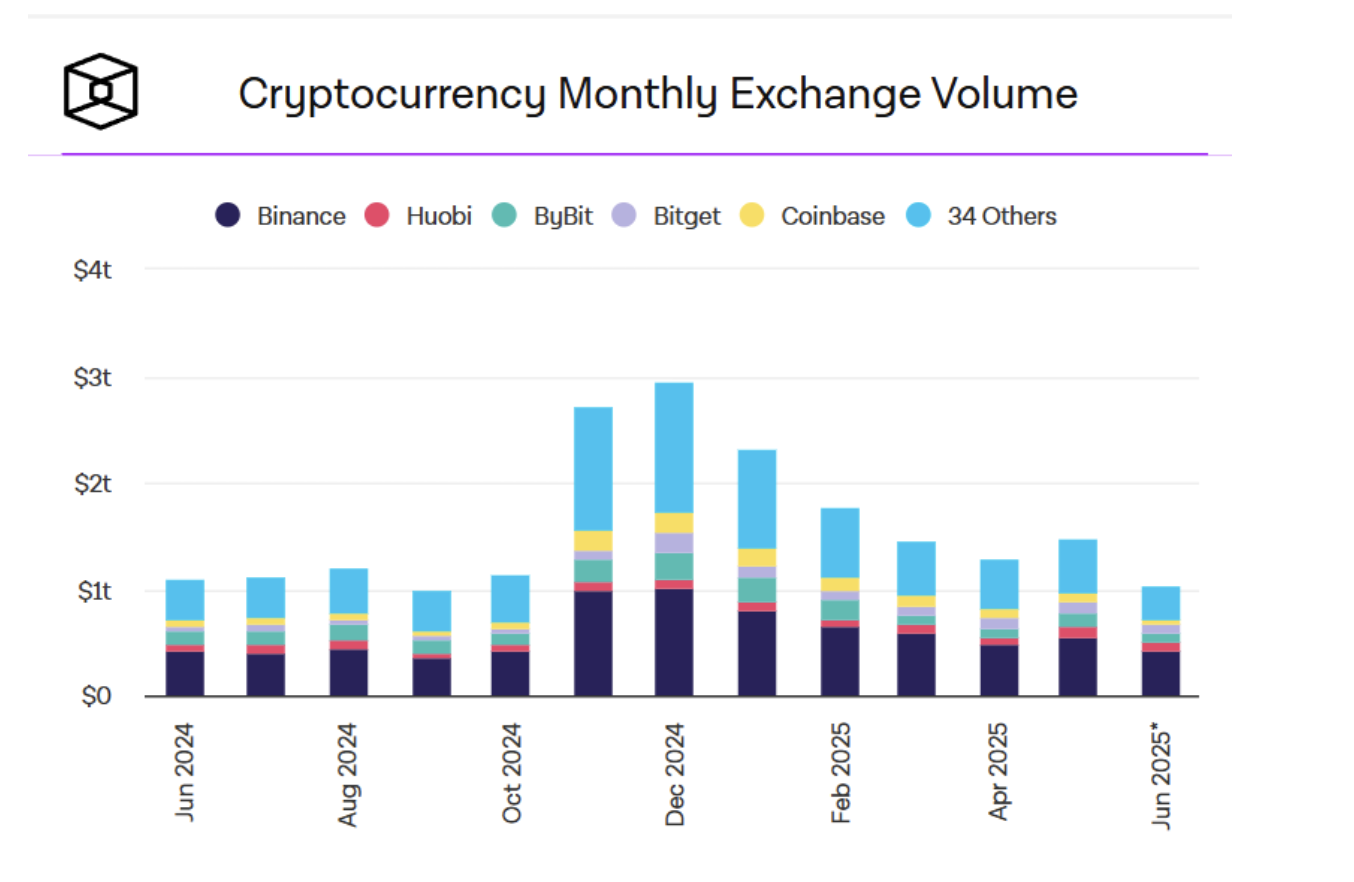
Spot Trading Volume on CEX. Source: The Block
June trading volume on decentralized exchanges reached $332 billion, a figure that stands out sharply compared to both the previous months and the same period last year. This growth reflects a continued shift in market preference toward DeFi. Contributing factors include improved user experience, lower fees, faster transactions, and growing trust in DeFi protocols.
Despite the attack on the ZKJ pool, DEX volumes continued to rise — showing that participants are willing to accept risks in exchange for the advantages DeFi offers. However, the Polyhedra incident serves as a reminder: high yields in liquidity pools often come with fragile liquidity structures.
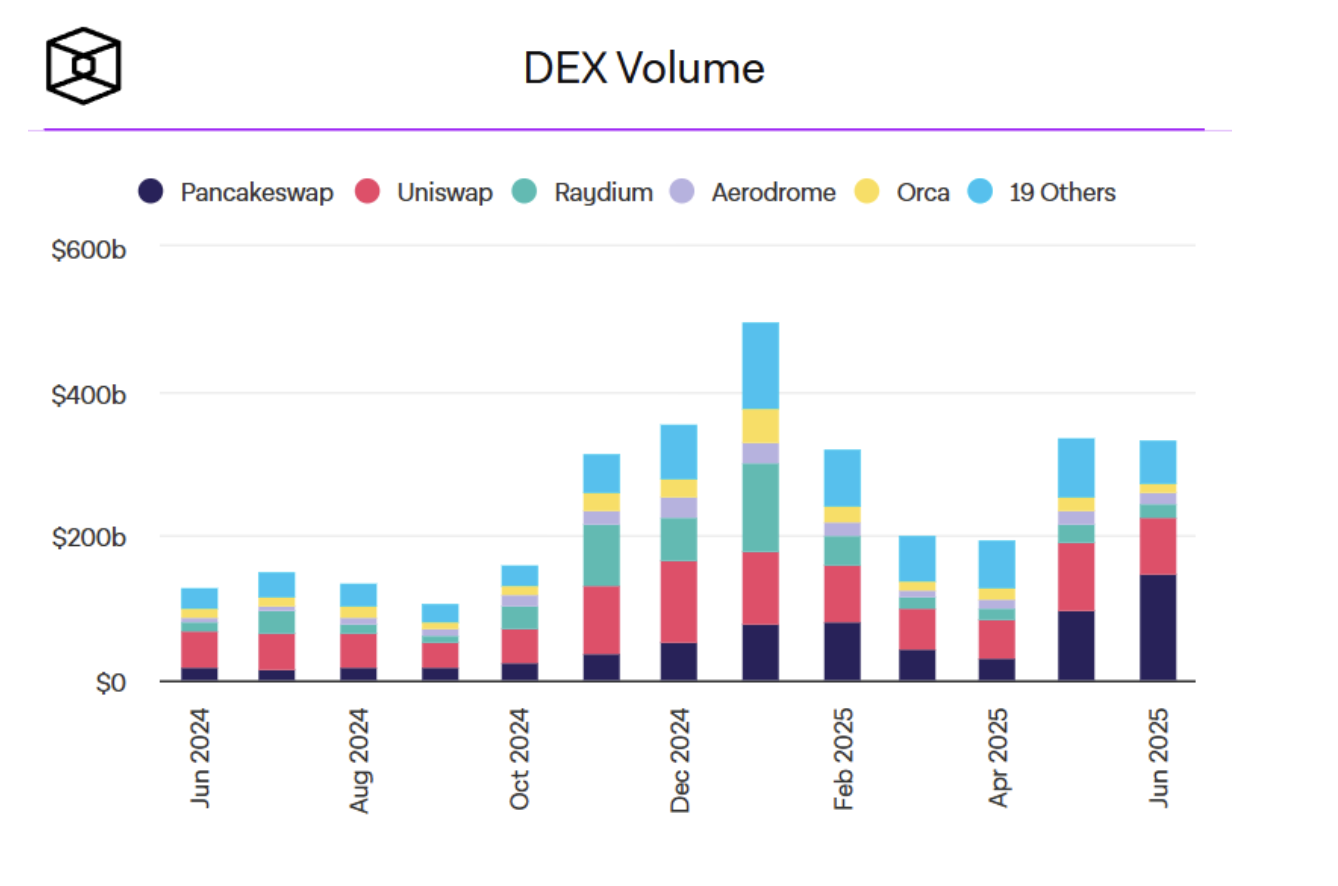
Spot Trading Volume on DEX. Source: The Block
DEX vs. CEX – A Shifting Market Structure
The share of DEX volume relative to CEX hit a record 28%, marking a significant milestone. The rise of DEXs to 28% of CEX volume reflects a maturing market, where participants are willing to embrace DeFi risks in return for greater asset control.
The chart below clearly illustrates the growing significance of decentralized platforms over the past year. More traders are consciously choosing DeFi for trading and liquidity provision — a trend that may reshape the architecture of the crypto market over time.
This trend signals that the market is gradually adapting to counterparty risks, actively seeking more flexible, decentralized tools. If momentum continues, DEXs could reach new all-time highs in market share by the end of the year.
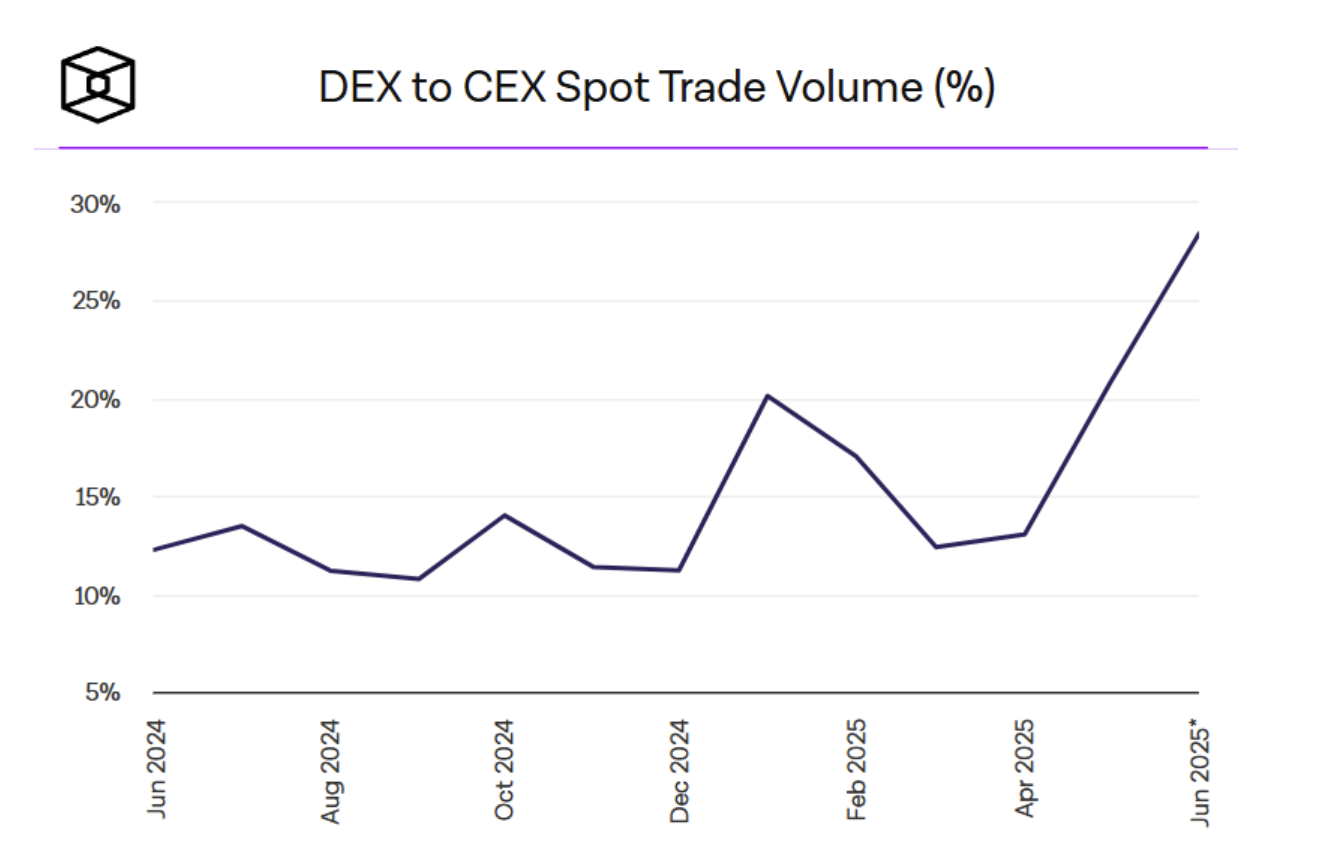
DEX to CEX Spot Volume (%). Source: The Block
Top Gainers & Losers
June did not produce a dominant sector leader. Gains and losses among the top 100 CoinMarketCap assets were mostly selective.
Top Gainers:
Top Losers:
Each asset had its own unique reasons for rising or falling, emphasizing that June’s market was driven more by project-specific factors than by broad sectoral trends. Price movements were fragmented, not systemic — suggesting investor focus has shifted to fundamentals and catalysts at the individual project level.
Google Trends Analysis
In June, we continued to monitor cryptocurrency trends using Google Trends data — a reliable indicator of retail investor interest. This tool has proven valuable: projects that previously appeared in trending searches often ended up among the top performers. One example is Hyperliquid (HYPE), which we highlighted back in April. In June, HYPE once again ranked among the most searched projects, indicating that this is not just a short-term spike in attention but a sustained trend in on-chain derivatives.
Investor interest in June was scattered. Attention shifted toward mature top-100 assets, such as Solana (SOL), which remained among the most frequently searched names. This reflects growing expectations of its role as a platform for the next wave of mainstream adoption — from meme coins to infrastructure solutions. Unlike in previous months, however, there was no clear meme coin hype in June.
Toward the end of the month, interest shifted from large-cap assets to low-cap projects outside the CoinMarketCap top-100. Among the standouts were Gains Network (GNS) and Magic (MAGIC), both of which we covered in our June social media updates.
Overall, June’s trend landscape showed positive sentiment. It confirmed the ongoing trend toward the development of on-chain derivatives (evidenced by growing interest in SEI as a trading-focused blockchain), rising attention to infrastructure projects, and increasing focus on low-cap assets with high upside potential. These patterns suggest the market is gradually transitioning from a cautious accumulation phase into one of active search for new growth catalysts.
Market Sentiment in June
Investor sentiment remains a leading indicator for potential market moves. Historically, fear is followed by greed, then euphoria — and the cycle repeats. After prolonged pessimism earlier this year and a return to neutral in late April, May was dominated by greed, fueled by price growth and overall optimism.
June, however, saw a shift. The Crypto Fear & Greed Index showed little volatility and remained mostly in the neutral zone throughout the month. This occurred alongside rising geopolitical risks, which typically increase market uncertainty and selling pressure.
The move to neutral helped cool off the market, preventing overheating and setting a foundation for more sustainable growth. A rapid transition from fear to euphoria would likely have led to a sharp correction. In contrast, June’s moderate sentiment can be interpreted as a healthy consolidation phase.
In short, June was a month of pause and recalibrated expectations. With strong institutional inflows and no signs of panic, the current market neutrality more likely reflects anticipation of a new upward move than the end of the bull cycle.
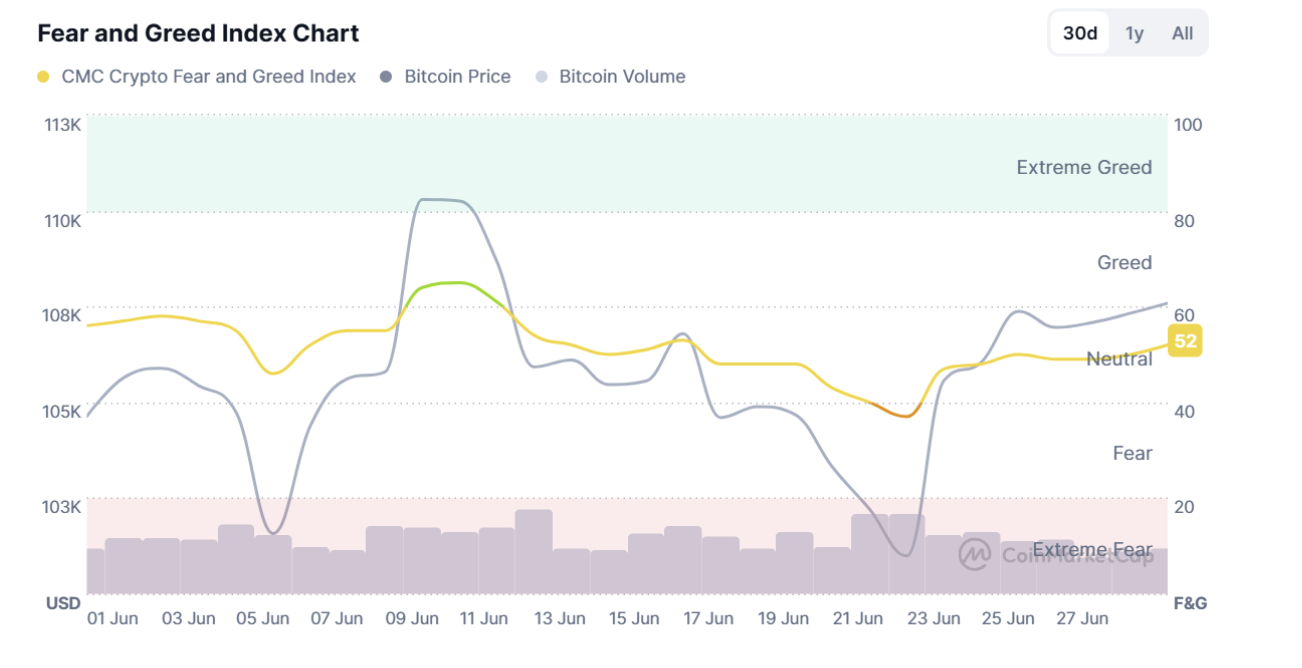
Fear and greed index. Source: CoinMarketCap
Risks & What Could Go Wrong
Despite the market’s resilience in June and the overall optimism, several risks could disrupt the current trajectory:
Renewed escalation in the Middle East could trigger a sharp capital outflow from risk assets.
Rising inflation due to tariffs may force the Fed to hold high interest rates longer, slowing capital inflows into crypto.
If ETF demand weakens while selling pressure continues, the market could remain in prolonged consolidation or even reverse trend.
Liquidity fragility in DeFi — as shown by the ZKJ incident — reveals that even major liquidity pools can be vulnerable to attacks.
ETH/BTC ratio and BTC dominance only hint at a potential altseason; confirmation from Q3 data is still needed.
Regulatory risks, including new restrictions on DeFi usage or increased oversight of stablecoins, remain a potential headwind.
Conclusion
June 2025 was a month of tests and transition for the crypto market. Following a powerful May rally, the market faced significant external pressures: geopolitical instability, war in the Middle East, and ongoing uncertainty in Federal Reserve policy. Despite this, the crypto market showed remarkable resilience.
Quick rebounds from shocks, strong inflows into ETFs, and growing interest in on-chain solutions all confirmed that the bull trend remains intact. June became a period of consolidation and expectation management. The Fear & Greed Index held in neutral territory, while Bitcoin traded mostly sideways above $100K — allowing the market to cool off after May’s rally. Institutional demand remained strong, as evidenced by significant inflows into BTC and ETH ETFs, reinforcing trust in the market and a willingness to continue accumulating.
Market trends shifted away from meme coin speculation toward infrastructure and on-chain trading solutions. The strengthening position of DeFi, rising DEX market share, and growing attention to high-potential low-cap projects reflect a participant base actively seeking new growth opportunities and embracing more risk-tolerant strategies.
In summary, June served as a pause before a possible new impulse. As external conditions stabilize and institutional interest remains firm, the market may be ready to enter the next phase of the bull cycle in the coming months.
If Bitcoin breaks through its all-time high, we could see a move toward $120K and beyond this summer. On the other hand, if it fails to hold the $100K level, a pullback to $95K could delay the rally. But as long as institutional inflows remain strong, the upward trend remains the base-case scenario.
Be prepared — the next wave of market activity may begin faster than most expect.
SimpleSwap reminds you that this article is provided for informational purposes only and does not provide investment advice. All purchases and cryptocurrency investments are your own responsibility.